Is Equity superior to Gold as an Asset Class

In our previous blog post on this topic, Why do we love gold: The economic value of gold, we had discussed the love for the Gold in our country. Despite several legislations aimed at reducing imports of foreign exchange guzzling yellow metal, our attraction to the precious yellow metal still persists and gold is one of the largest components of our import basket, even as recent as last year. In the previous post, we also discussed the economic value of gold and we saw that, gold returns are much lower in the post liberalization period (1991 onwards) compared to pre liberalization period. In this post, we will discuss equity versus gold as an asset class.
Is Equity superior to Gold as an Asset Class? The answer may be obvious to many of our readers, who read investment blogs on the web or follow investment experts on television business channels. These blogs cite historical returns of equity versus gold and conclude that equity is the superior asset class because over a long investment horizon, equity has outperformed gold. Many a times I feel that, investment experts and bloggers give their expert opinion on a topic without delving into the psyche of the Indian investor. So despite the merits of these expert opinions, mostly, it has limited or no appeal to the investor.
The experts cite historical returns of gold versus equity, but return is not the most important factor for people investing in gold. Since time immemorial, gold was thought of as a safe asset; an asset whose value never diminishes. Right or wrong, this perception still persists. Therefore, any discussion on gold versus equity cannot simply be limited to returns; we have to discuss risks also. In this blog post, we will discuss risk to return trade-off in gold versus equity investments.
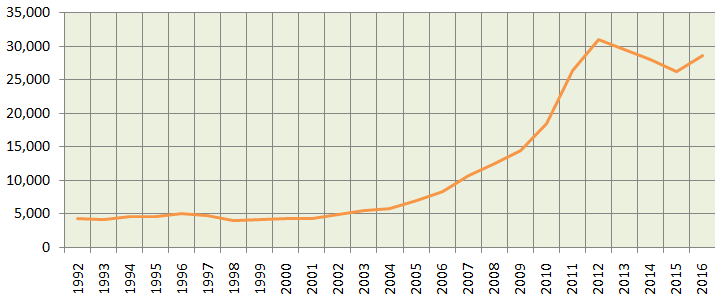
Let us first discuss, what safe asset means from a practical standpoint. Safe asset, in the strictest sense, is something, which never diminishes in value. The price of gold changes every day; it can go up one day and fall another day. Therefore, in the strictest sense, gold is not a safe asset. In 2013, the average price per 10 grams of gold was Rs 29,600 and in 2015,the average price per 10 grams of gold was Rs 28,000. We have said a number of times in our blog that, investment horizon is an important factor in risk.People who invest in gold have a long investment horizon and over a long tenure perceive gold to be a safe asset. At the same time, while equity is volatile in the short term, we discussed in our post, How Investing in Equities for the long term reduces risk, that the volatility of equity as an asset class reduces with increase in investment tenures. Let us now discuss gold versus equity on various risk return parameters.
The chart below shows the annual average price of 10 grams of gold in India over the past 25 years. The annualized return of gold over the past 25 years was around 8.1%.

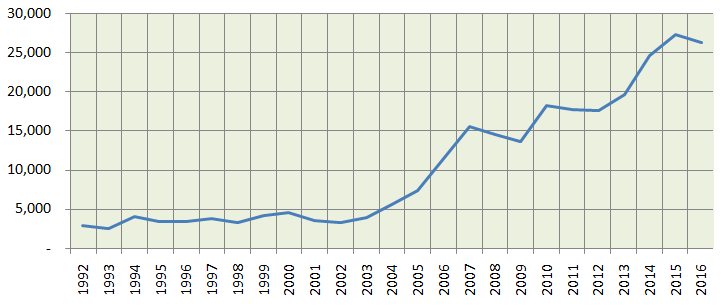
Let us now see, how gold compares with equity. The chart below shows the average annual price of BSE-Sensex over the past 25 years. The annualized return of Sensex over the past 25 years was around 9.6%.

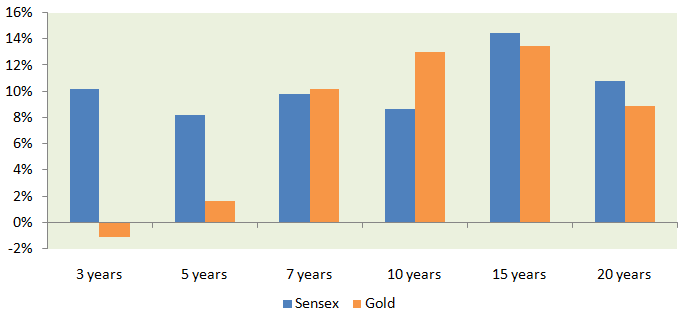
Clearly over the past 25 years, the Sensex outperformed Gold, which would not be surprising to many of our readers. But how has it performed versus Gold over other time-scales.

Clearly Sensex outperformed Gold over most time-scales, but Gold outperformed Sensex over the last trailing 7 and 10 years timescales. For example, some can argue that, the last 5 years was largely a period of bullish equity market and bearish gold market. On other hand, others will argue that the last 10 year period involved the worst period for equity (2008) and the best period for gold in many years. The problem with trailing returns is that, it is dependent on market conditions during the period.
We can resolve the dependence on market conditions by using rolling returns as a measure of performance. We have discussed a number of times in our post that, rolling returns is the best measure of an asset’s performance in various market conditions. Rolling returns tell us how an asset performed in bull market, bear market, mildly bullish market, mildly bearish market, mixed market, so on so forth. Rolling returns as a measure of performance is therefore independent of market conditions.
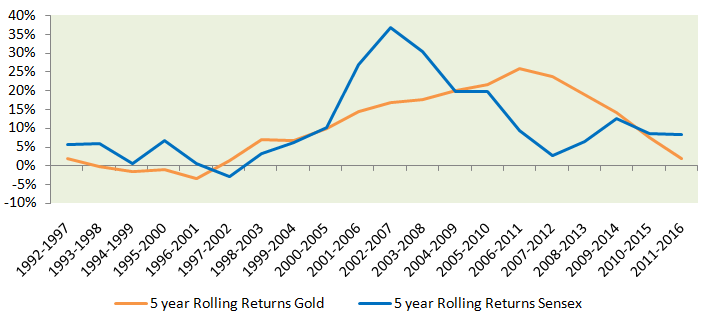
The chart below shows the 5 year annual rolling returns of Gold versus Sensex from 1992 onwards.

You can see that the Sensex outperformed Gold in most except in the late 90s and early 2000s, and then from 2008 to 2014. Since 2014, Sensex has been outperforming gold again. More insights related to risk and return are revealed when we look at the rolling returns parameters, as shown in the table below.

You can see that the maximum rolling return (best case scenario) of Sensex was higher than Gold. At the same time the minimum rolling return (worst case scenario) of Sensex was lower than Gold. The average rolling returns of the Sensex was also higher than Gold. Therefore, we can say that, the risk return trade-off in Sensex was better than Gold.
Many traders / investors use risk return to make investment decision. Risk return trade-off tells the trader or investor if the higher returns justify the risk taken. You can see that, the maximum and average returns of Sensex was higher than Gold, while the maximum loss was lower. Therefore, the risk return trade-off is better in Sensex compared to Gold. We can also use Sharpe Ratio (a measure of risk adjusted returns) to compare risk return of these two asset classes, but average investors may find Sharpe Ratio difficult to comprehend; so we looked at some simpler risk versus return measures like maximum, minimum and average.
Conclusion
Earlier in the post, we saw that, over the last 15 to 20 year period, Sensex outperformed Gold. From the 5 year rolling return analysis, we can conclude that, the risk return trade-off is better in Sensex compared to Gold. We can also use Sharpe Ratio (a measure of risk adjusted returns) to compare risk return of these two asset classes, but average investors may find Sharpe Ratio difficult to comprehend; so we looked at some simpler risk versus return measures like maximum, minimum and average. When you make investment decisions, with respect to different asset classes, you should look at risk return trade-off objectively instead of going by commonly held perceptions. A knowledgeable investor is a smarter and eventually richer investor.
Mutual Fund Investments are subject to market risk, read all scheme related documents carefully.
RECOMMENDED READS
LATEST ARTICLES
- Why you need to have hybrid mutual funds in your portfolio: Different types of funds Part 2
- Why you need to have hybrid mutual funds in your portfolio: Misconceptions Part 1
- Which is the best time to invest in mutual funds
- Economic slowdown: Is it real and what should you do
- Importance of liquidity in investing: Mutual funds are ideal solutions
An Investor Education Initiative by ICICI Prudential Mutual Fund to help you make informed investment decisions.
Quick Links
Follow ICICI Pru MF
More About ICICI Pru MF
POST A QUERY


