Should you invest in Long Term Debt funds or avoid

After the last monetary policy announcement by the RBI in February, I read several articles and news reports where the financial experts were asking investors to avoid long term debt funds. Strangely enough, just 3 - 4 months back, when yields tumbled in the wake of demonetization, experts were recommending long term debt funds to investors. It is understandable that, debt fund investors may find such diametrically opposite views in a space of just 3 months quite confusing. I have also read articles where the blogger said that yields (interest rates) have fallen a lot in the last 2 years and suggested that, there may not be enough room to fall much further. There can be as many opinions on a topic as there people who views on the matter. That is why our endeavour in Advisorkhoj is to educate investors so that, they can form educated views and make investment decisions, without being confused by conflicting views which keep appearing in the media.
Importance of investment objectives
Unlike news portals, where the primary objective is to describe the impact of an event, our primary objective in Advisorkhoj is to inform and educate investors; investors are the most important constituency for us. I have repeated ad nauseam in my blog that, the most important part of any investment is you or in more specific terms, your goals. Your investment decision should be based on your goal and not on the views of other people, who may not be aware what your goals are.
Let us understand this with reference to long term debt funds. We have explained in our blog before that, bond prices rise with fall in interest rates and vice versa. Prices are based on interest rate expectations. There are 6 monetary policy review meetings of RBI each financial year, which means RBI announces interest rate policies 6 times every year.
If the bond market expects RBI to cut rates, bond price will go up and yields will fall. If the RBI cuts rate, yields will fall and prices will go up further; consequently debt fund NAVs will rise further. Long term debt fund NAVs rose 1.5% in just one month in September – October 2016 after RBI cut repo rates. If the RBI holds rates or raises rates, bond prices will fall and if prices fall debt fund NAVs will also fall. When RBI kept rates unchanged in February long term gilt funds lost 2% in just 2 days. If the market expects RBI to hold rates but the RBI increases it, then bond prices and debt fund NAVs will fall. If the RBI cuts rate, bond prices and fund NAVs will rise unexpectedly. This situation will recur 6 times every year. As an investor you cannot change your debt funds strategy every 2 – 3 months. You should invest based on your investment goal, irrespective of what action RBI takes in the interim.
Investment horizon
Investment horizon should be an important consideration in long term debt funds because their prices can be quite volatile in the short term as explained above. Over a long investment horizon, however, we have periods of both rising and falling yields; long term debt funds can do well over a 2 – 3 year investment horizon, especially if the long term trajectory of interest rates is declining. In fact a three year investment horizon is advantageous for debt fund investors because there are significant capital gains tax benefits.
Smart investors also make investment decisions based on economic outlook. Long term debt funds work very well if the trajectory of interest rates over the next few years is downwards, irrespective of short term movements in the interim. If trajectory of interest rates over the next few years is upwards, then investors are better off investing in short term debt funds where they can capture higher yields if interest rates go up and get better returns.
Long term trajectory of interest rates in India at this time
How will you know if long term trajectory of interest rates is upwards or downwards? Reading the headline of RBI monetary policy will not give you a sense of long term interest rate trajectory. You have to listen to what the RBI Governor says. The present Governor and his predecessor have both reiterated their commitment to accommodative monetary policy. In accommodative monetary policy the RBI aims to stimulate growth by making money cheaper for businesses to borrow. An accommodative monetary policy stance implies that the long term trajectory of interest rates will be downwards.
You may also have heard that, the current and past RBI governors talking about balancing twin objectives of inflation and growth. Managing inflation is the most important objective of any central bank, including the RBI, because inflation hurts the weaker sections of the society most. The RBI is targeting inflation at 4% and the CPI inflation has been below the target for the last few months.
However in February, the RBI was concerned that core inflation (WPI) hardened a bit and hence, contrary to what the market was expecting, it did not rate cut. The RBI will keep a watch on inflation, but the trend over the past two years shows inflation in a downward trajectory and hence it is very much possible that we can see further rate cuts in the future.
Finally, the RBI cannot ignore the global macro situation, especially the interest regime in the United States. If the US Federal Reserve hikes interest rates (Fed Funds rate), then money will flow to the US (due to higher yields) and this will have an effect on our foreign exchange rate (INR/USD rate). If the rupee depreciates, imports will become more expensive and this will have an effect on inflation.
Therefore, the RBI will be monitoring the Fed actions very closely before making interest rate decisions. However, investors should understand that, the headline interest rate (repo rate) is not the only factor in bond pricing. Bond prices and yields depend on the demand and supply situation of bonds, both Government and corporate.
With lower fiscal deficit we are likely to see less Government borrowing (the Government is the biggest borrower in our country). It is simple intuitive logic that, if you need to borrow more money, you will be ready to pay higher interest rate and if you need to borrow less money, you will not be ready to pay higher interest rate. Hence, even if the Fed increases interest rates in the US, we may not see Government bond yields hardening. Coming to private sector borrowing, even though the IIP showed a healthy jump last month, demand for credit in the private sector is also muted; therefore, given the demand and supply situation, we may not see corporate bond yields hardening. If bond yields remain soft and soften further in the long term, long term debt funds will be giving good returns over a long investment horizon. Long term structural impact of Government initiatives like demonetization and GST will also help long term debt funds, but it is difficult at this point of time, to fully understand the impact of these structural initiatives.
How much can bond yields fall from here?
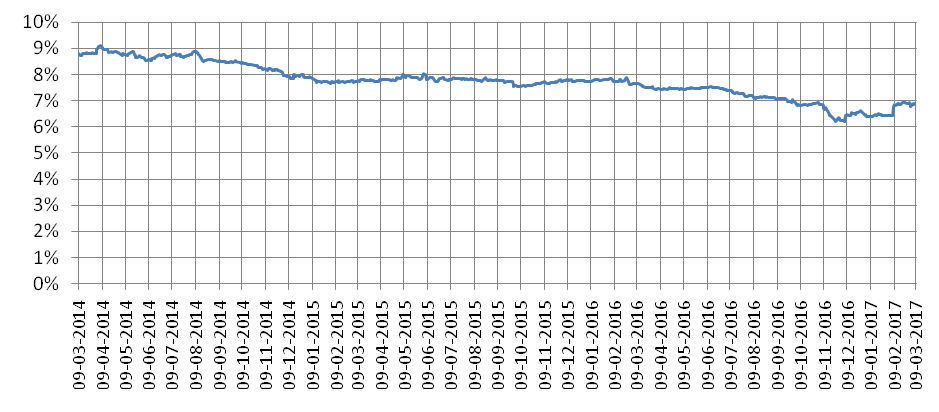
Income funds, dynamic bond funds and long term gilt funds, all sub-categories of long term debt funds, have given 9.7 – 11.2% annualized returns over the past three years. These higher than average returns relative to traditional fixed income investments, were aided undoubtedly by falling bond yields. In the last 3 years, the 10 year Government bond yield has fallen by nearly 200 basis points (please see chart below).

Source: Investing.com
Some debt fund investors may be concerned, how much upside can be expected from here onwards; in other words, how much further can bond yields fall. It is very difficult to forecast how much bond yields can fall in the future. We have explained the economic rationale of why we can expect a benign interest rate regime over the next few years. Let us understand with the help of statistical analysis bands within which we can expect interest rates to be with a certain degree of confidence.
Bollinger Bands
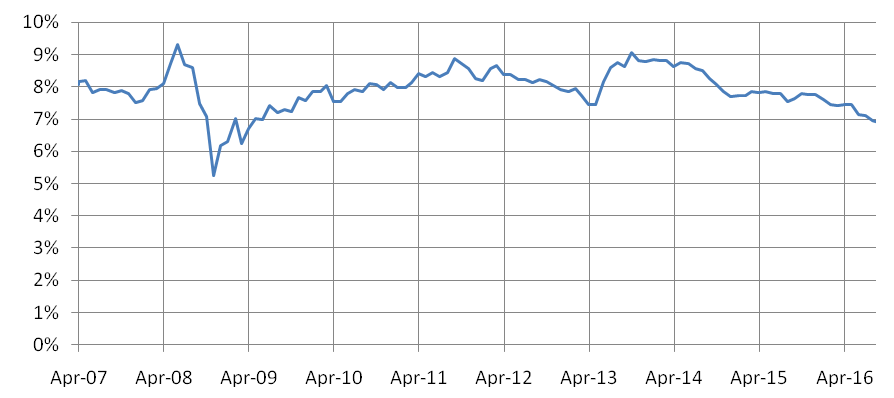
Bollinger Band is a popular technical analysis concept. Bollinger Bands indicate levels (upper and lower) within which we can expect the price or yield to be. Bollinger Band is plotted as 2 standard deviations from the 20 period moving average of the variable (in our case bond yields). 2 standard deviations from the average imply 95% confidence. Before we plot the Bollinger Band, let us see how the 10 year bond yield changed over the last 10 years.

Source: Investing.com
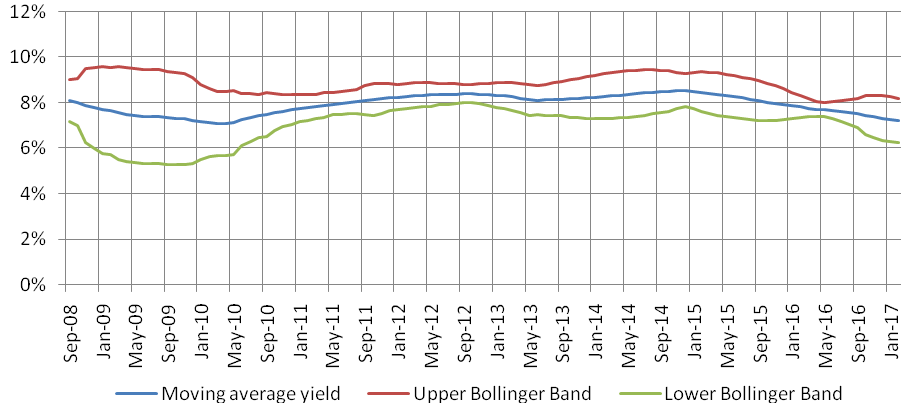
You can see that, the 10 year yield was at around 8%, 10 years back; it climbed to more than 9% in early 2008 and again in 2013. The yield has been on a declining trend since 2013 and is now at around 7%. Let us now plot Bollinger Bands for the 10 year Government bond yield over the last nearly 10 years. For the benefit of Advisorkhoj readers, I have calculated Bollinger Bands based on moving averages and standard deviations. The exact calculation methodology is outside the scope of this article and also not very relevant, but readers may find the observations relevant. The chart below shows the Bollinger Band graph of the 10 year bond yield.

Source: Investing.com
There are many features in a Bollinger Bands which are outside the scope of our discussion. For now, focus your attention on the red and green lines. The red line indicates the maximum level to which yields can rise at any given point of time and the green line indicated the minimum yield level. The green line, as on March 8, 2017 indicates that the lower Bollinger Band for 10 year yield is 6.25%. The current yield is 6.86% and therefore, there is room for yields to fall by further 60 basis points based on the Bollinger Bands theory.
Further note that, the band (the red and green lines) expands and squeezes at different points of time. The band expanding indicates a period of high volatility and the band squeezing indicates a period of low volatility. Periods of high volatility are usually followed by periods of low volatility and vice versa. The other very important thing to note about Bollinger Bands is that, it takes time for price or yield to rise or fall to the Bollinger Band levels at any point of time. The lower Bollinger Band for the 10 year yield was around 7% in May, 2015. However, the actual 10 year yield fell to 7% only in March – April, 2016. Sometimes it may take even longer and hence, you need to have a sufficiently long investment horizon for long term debt funds.
Conclusion
It is impossible to predict the future; we need to rely on good logic to form expectations of returns. Hopefully, most of the times, the outcome should be consistent with good logic, but sometimes it may not be. That is why you need to have appetite for risks when investing in long term debt funds. In this post, we discussed the economic and technical rationale of why bond yields may fall further in the medium to long term. If bond yields decline by 50 bps in the medium term the price of the bond with a modified duration of 5 years (which is the average duration of long term debt funds), bond prices can rise by 2.5%. From the perspective of investor returns, the bond price appreciation is over and above, the interest earned from the bond. You can discuss with your financial advisor if long term debt funds are suitable for you.
Mutual Fund Investments are subject to market risk, read all scheme related documents carefully.
RECOMMENDED READS
LATEST ARTICLES
- Why you need to have hybrid mutual funds in your portfolio: Different types of funds Part 2
- Why you need to have hybrid mutual funds in your portfolio: Misconceptions Part 1
- Which is the best time to invest in mutual funds
- Economic slowdown: Is it real and what should you do
- Importance of liquidity in investing: Mutual funds are ideal solutions
An Investor Education Initiative by ICICI Prudential Mutual Fund to help you make informed investment decisions.
Quick Links
Follow ICICI Pru MF
More About ICICI Pru MF
POST A QUERY


