Do you know to make sense of mutual fund factsheet: Part 2

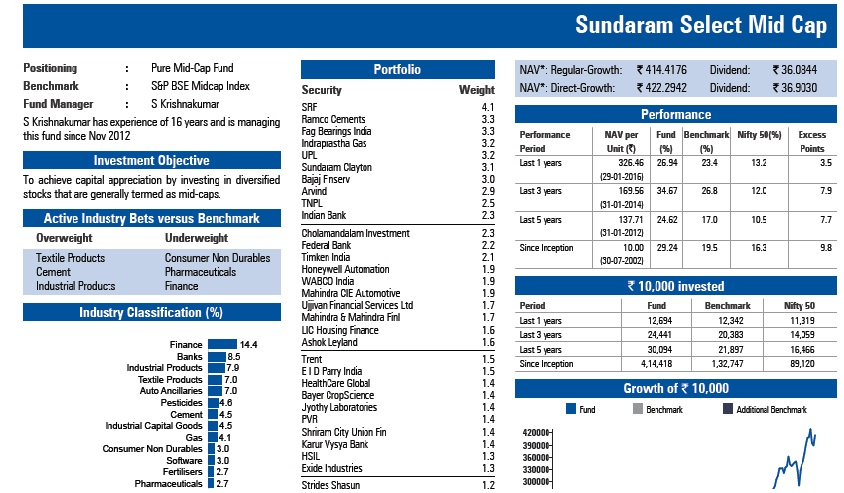
In this two part post, we are discussing how to read factsheets more effectively, so that you have a better understanding of the schemes that, you have invested in or plan to invest in. To help readers understand the concepts well, we are explaining different elements of an actual mutual fund factsheet (Sundaram Select Midcap Fund). In previous part, we discussed different sections contained in the top half of the Sundaram Select Midcap Fund sheet (please see below the image of the top half of the factsheet).

Source: Sundaram Mutual Fund January 2017 factsheet
In our post, Do you know to make sense of mutual fund factsheet: Part 1, we explained different sections of this factsheet extract (top half the factsheet). If you have not had a chance to read our previous post, we urge you to go through it because the top half of the factsheet contains almost 80% of the information related to the scheme. The bottom half of the factsheet also contains some useful scheme informationand its performance related attributes, which will discuss in this post. For the sake of continuity, we will use the same scheme factsheet discussed in our previous post. Please see below the bottom half of the Sundaram Select Midcap Fund January 2017 factsheet.

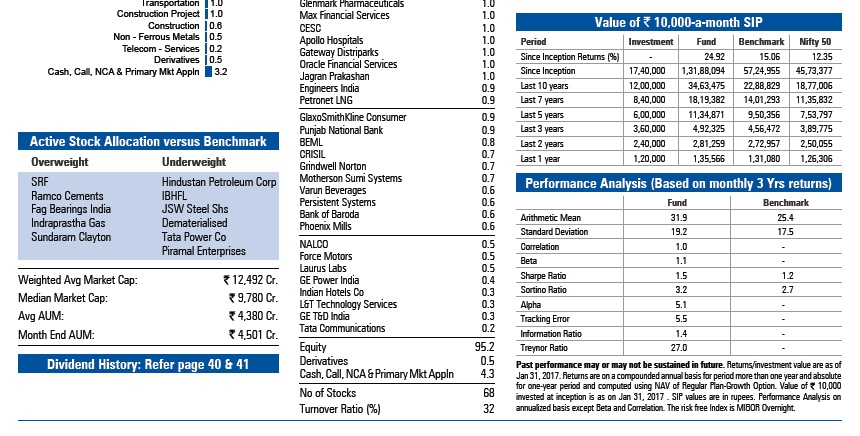
Source: Sundaram Mutual Fund January 2017 factsheet (bottom part)
Active Stock Allocation versus Benchmark
Let us first focus on the left side of the factsheet extract. Active Stock Allocation versus Benchmark tells the investors which active stocks are overweight or underweight versus the Benchmark. If you look at the top half of the factsheet, you will notice that, the scheme benchmark is S&P BSE Midcap index. Overweight stocks are the ones whose holding as percentage of portfolio value is more than the weight of the same stocks in the BSE Midcap Index. The fund manager is overweight on these stocks because he is bullish about their prospects. Underweight stocks are the ones whose holding as percentage of portfolio value is less than the weight of the same stocks in the BSE Midcap Index. The fund manager is less bullish or has a neutral stance on these stocks.
Investors should understand that overweight and underweight are relative concepts. Just because a fund manager is underweight on a stock, it does not necessarily mean that, he is bearish on the stock. In an actively managed fund, if there are redemptions from the scheme, the fund manager will not sell shares of all the stocks in the scheme portfolio to fulfil the redemption requirements. He may selectively sell a few stocks that he is underweight on, so that he can get the best results?possible results for unit holders who remain invested. Similarly when there are fresh flows in the scheme, the fund manager will not buy shares of all the stocks in the scheme portfolio but the stocks he is overweight on, so that he can create higher alphas for investors.
Market Capitalization Information
Just below in Active Stock Allocation versus Benchmark in the factsheet extract shown above, you will find the market cap information of the portfolio. Let us understand what each of the terms in that section mean. The weighted average market cap of the scheme portfolio is the average of market cap of all the stocks in the portfolio weighted by their proportions in the portfolio. For example, consider that there are three stocks in a portfolio, Stock A, Stock B and Stock C. Market cap of stock A is Rs 5000 Crores, Stock B is Rs 9,000 Crores and Stock C is Rs 10,000 Crores. The weights of the three stocks are 30%, 20% and 50% respectively. The weighted average market cap of the portfolio will be equal to 5,000 X 30% + 9,000 X 20% + 10,000 X 50% = Rs 8,300 Crores. The weighted average market cap of Sundaram Select Midcap Fund in January 2017 was Rs 12,492 Crores. Market cap range of midcap companies is usually between Rs 5,000 to Rs 20,000 Crores. You can see that, the weighted average market cap of the scheme is right in the middle of the range and therefore, you can conclude that the fund manager has been able to stick to his positioning (discussed in our previous post) as a pure midcap fund.
If you list all the stocks in the scheme portfolio in ascending order of market cap, the market cap of the stock in the middle is the median market cap. Carrying on your 3 stock portfolio example, the market capitalizations of the three stocks in ascending order are Rs 5,000 Crores (Stock A), Rs 9,000 Crores (Stock B) and Rs 10,000 Crores (Stock C). Since Stock B is the middle, the median portfolio market cap is Rs 9,000 Crores. Readers should note that, median is not the average it is simply the middle value.
Assets under Management
The Average AUM is the average of the assets under management of the scheme at the beginning of the month and end of the month. You can see that, the month end AUM is more than the average AUM.
Turnover Ratio
The middle part of the factsheet extract has portfolio information, which we covered in our previous post; however, at the very bottom of the middle section, you will see a term Turnover Ratio. Turnover ratio is a measure of how much of the scheme portfolio changed in the last 1 year. If the turnover ratio is 100%, it means that the fund manager replaced all the holdings once in the last 1 year. The turnover ratio of the scheme, as shown in the factsheet extract, was 32% only. This shows that, the fund manager has strong conviction in the stocks he has bought and does not churn the portfolio much. Different investment experts have different opinions on turnover ratios. Most experts believe that, low turnover ratio is good, because it reveals the “buy and hold” mindset of the fund manager.
High portfolio turnover involves higher transaction costs, which in turn may affect the investor returns. However, some investment experts say that, fund managers who churn their portfolios more, look to actively exploit market opportunities based on valuation differentials. For midcap funds though, I would favour low portfolio turnover because midcap investments are by nature longer term investments compared to large caps.
SIP Returns
Coming to the right side of the factsheet extract, the section “Value of Rs 10,000 – month SIP” is pretty simple to understand, yet is very powerful tool to explain the wealth creation history (and thereby, potential) of the scheme using systematic investment plan (SIP). The table shows how much wealth could have been created through Rs 10,000 monthly SIP in the scheme over various time periods. To give investors a sense of the value added by the fund manager, the table also shows the wealth created by a hypothetical SIP in the benchmark BSE – Midcap Index and the frontline market index the Nifty.
Conclusion
The last section, Performance Analysis, will require a separate article because it includes some analytical concepts related to performance and risk. We will cover this in our next article in this series. Please stay tuned.
Mutual Fund Investments are subject to market risk, read all scheme related documents carefully.
RECOMMENDED READS
Sundaram Asset Management Company is the investment manager to Sundaram Mutual Fund. Founded 1996, Sundaram Mutual is a fully owned subsidiary of one of India's oldest NBFCs - Sundaram Finance Limited.
Quick Links
- Interview - Mr. Dwijendra Srivastava - CIO - Fixed Income
- Interview - Mr. Sunil Subramaniam - CEO
- Sundaram Select Midcap Fund: Consistent outperformance makes it a big wealth creator
- Interview - Mr. Sunil Subramaniam - CEO
- Fund Manager Interview - Mr. Krishna Kumar - CIO - Equities
- Sundaram Rural India Fund: This thematic Mutual Fund aiming good long term returns
- Sundaram Equity Multiplier: Long term wealth creation potential
- Our Articles
- Our Website
- SIP one sheeter-Investor Education initiative
- Sundaram Asset Management Singapore
- Returns Calculator
- SEBI Investor Awareness Initiative
- Check your KYC Status
- KYC Forms & FAQs
- Recieve your PIN
- A note on NIGO
- FAQs on RGESS
- FAQs on Direct Plan
- Receive Updates
- Share your views
- Transmission Checklist
- Equity Application Form
- Fixed Income Application Form
- Transaction Slip
- Factsheet May - 2016
- MF Tax Reckoner 2015
Follow Sundaram MF
More About Sundaram MF
POST A QUERY


