Do you know the different performance parameters of equity mutual funds: Part 1

When researching funds for investment purposes many retail investors and financial advisors look at the historical returns of mutual fund schemes. If you read the fine print of a mutual fund’s disclaimer, you will often a see a line, “past returns are not indicators of future returns”. Some investors may use past returns to compare different mutual schemes and the select the ones which have outperformed. However, the schemes which have outperformed in the past may not outperform in the future even within the same product category. This is because of the fundamental relationship between risk and return; funds which take more risks tend to outperform in bull markets and those which take less risk outperform in bear markets. In my view, risk adjusted return is the most important performance factor for long term investors.
In this two part blog post, we will discuss various risk and risk adjusted performance parameters of mutual funds. We will discuss multiple parameters and Investors should understand all these parameters and try to use most of them in making investment decisions. I understand that making decisions based on multiple factors is not easy, but unfortunately, there is no single formula that will ensure investing success. However, towards the end of this post, I will try to explain the most important performance parameter for equity mutual funds. You will find data on all the performance parameters discussed in this post, in fund factsheets. You can also find scheme wise performance parameter data in mutual fund research websites like Morningstar.in, Valueresearchonline.com, Advisorkhoj.com etc.
Arithmetic Mean of Monthly Returns
Arithmetic Mean of monthly returns is simply the average of monthly returns over the last 3 years (or 5 years or 10 years). The period of Arithmetic Mean is mentioned in the factsheet. Arithmetic Mean is usually shown in annualized terms. Arithmetic Mean is a measure of returns and by itself, does not have a lot of significance, but it is used to calculate a very important risk parameter, Standard Deviation or Volatility and several other risk adjusted return parameters like Sharpe Ratio, Sortino Ratio etc.
Standard Deviation
Standard Deviation is a statistical concept. It is a measure of dispersion of monthly returns from the Arithmetic Mean or average. In the world of investments, standard deviation is a measure of risk. Higher the standard deviation, higher is the investment risk and vice versa. In many investment literatures, standard deviation and volatility are used interchangeably. We will skip the mathematical formula of standard deviation in this post, as some of our readers may find it slightly complex. Moreover, standard deviation of a scheme is readily available in the factsheet and research websites. You can find mutual fund schemes ranked in quartiles on basis of standard deviation in our research tool, Mutual Fund Volatility Ranking. Investors should understand that, standard deviation of a fund is directly linked to the market volatility. Therefore, instead of just looking at the standard deviation of a fund, you should compare the standard deviation of a fund with the standard deviation of the benchmark index.
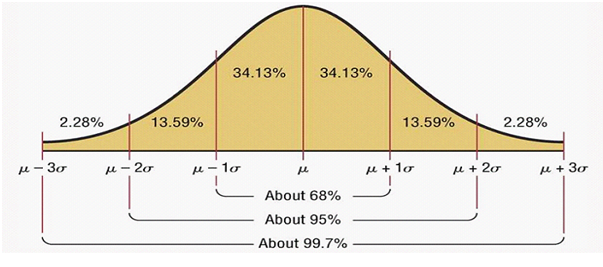
Another useful application of standard deviation is defining a range of expected returns at a certain confidence levelbased on normal distribution or bell curve of returns. Let us try to understand how a bell curve works.

In the chart above, µ is nothing but the average (Arithmetic Mean) and σ is the standard deviation (SD). The area under the curve is the probability of returns. For example, the probability of getting between Average – 1 Standard Deviation and Average + 1 Standard Deviation returns is 68%. Let us now focus on the left side of the bell curve because the left side shows the downside risks, which average retail investors are worried about. The table below shows the probability of the returns on the downside (bear market):-

If you know the arithmetic mean and standard deviation, you can guess the probabilities of various return scenarios on the downside. This can be a useful financial planning tool, if you are worried about, how much your investment value can fall in bear markets.
Sharpe Ratio
Sharpe Ratio is a measure of risk adjusted returns. This metric was developed by Nobel Laureate, William Sharpe and has become the industry standard for risk adjusted returns. Sharpe Ratio is the excess of average returns over risk free rate (Arithmetic Mean – Risk Free Rate) divided by the standard deviation. Risk free rate, as the name suggests, is the risk free return rate in the economy. Usually Government Treasury Bills rates, overnight inter-bank lending rates (MIBOR) etc., are taken as the risk free rate. Some mutual funds research firms also use bank fixed deposit rates as the risk free rate.
The Sharpe Ratio formula suggests that it gives equal importance to return and risk. Sharpe Ratio tells the investor whether the fund manager delivered high returns by taking more risk or through superior stock selection that will ensure consistent performance in different market cycles. If the return of a fund is high, but the Sharpe Ratio is not high (relative to benchmark or product category), it means that the fund manager is taking excessive risk. If the return is high and Sharpe Ratio is also high (relative to benchmark or product category), it means that the fund manager has delivered good risk adjusted returns.
The major limitation of Sharpe Ratio is that, it assumes normal distribution or bell curve of returns. If you go back to the bell curve, discussed earlier in this post, you will see that it is symmetrical, or in other words, the probability of high and low returns is the same. This works in theory, but actual data shows us that, some funds outperformed others both in bull and bear markets. These funds are the consistent performers (please see our tool, Top Consistent Mutual Fund Performers).The bell curve for these funds is likely to be skewed (not exactly symmetrical). The asymmetry problem is solved by using the next performance parameter, Sortino Ratio. Nevertheless, Sharpe Ratio is a very useful tool for investors, especially if you want to compare risk adjusted performance of equity funds and hybrid or balanced funds.
Sortino Ratio
Sharpe ratio measures the performance of a fund (relative to risk free rate) per unit of standard deviation. Standard deviation is a bit like the justice lady holding scales in courtroom dramas of old Hindi movies. Standard deviation is simply a measure of volatility. Volatility can be good or bad. If a fund performs exceptionally well in bull market, the volatility will be high, but this is good volatility. If a fund performs very poorly in bear market, again the volatility will be high, but this is bad volatility. The investor is mostly concerned with bad volatility, which in finance terms, is described as downside volatility or downside risk.
Downside volatility is essentially the standard deviation when the market is down. We will not discuss the mathematical formula of downside volatility because you can find mutual fund schemes ranked in quartiles on basis of downside volatility in our research tool, Downside Volatility Ranking. As discussed earlier, Sharpe Ratio does not distinguish between good and bad volatility because it uses standard deviation to calculate risk adjusted return performance. As a result, funds which performed exceptionally well in bull markets and did not perform very badly in bear markets, may not show good performance in terms of Sharpe Ratio.
Sortino Ratio solves this problem because it uses downside volatility / standard deviation and not overall standard deviation. The formula of Sortino Ratio is the excess of average returns over risk free rate (Arithmetic Mean – Risk Free Rate) divided by the downside standard deviation. As you can see, Sortino Ratio is simply a modification of Sharpe Ratio, using downside volatility or standard deviation. In my view, Sortino Ratio is a more useful tool for measuring risk adjusted performance of equity funds.
Conclusion of this part
In this part of two part post, we discussed various performance parameters of mutual fund schemes. In the next part, we will discuss two important performance parameters, alpha and beta. Please stay tuned.......
Mutual Fund Investments are subject to market risk, read all scheme related documents carefully.
RECOMMENDED READS
Sundaram Asset Management Company is the investment manager to Sundaram Mutual Fund. Founded 1996, Sundaram Mutual is a fully owned subsidiary of one of India's oldest NBFCs - Sundaram Finance Limited.
Quick Links
- Interview - Mr. Dwijendra Srivastava - CIO - Fixed Income
- Interview - Mr. Sunil Subramaniam - CEO
- Sundaram Select Midcap Fund: Consistent outperformance makes it a big wealth creator
- Interview - Mr. Sunil Subramaniam - CEO
- Fund Manager Interview - Mr. Krishna Kumar - CIO - Equities
- Sundaram Rural India Fund: This thematic Mutual Fund aiming good long term returns
- Sundaram Equity Multiplier: Long term wealth creation potential
- Our Articles
- Our Website
- SIP one sheeter-Investor Education initiative
- Sundaram Asset Management Singapore
- Returns Calculator
- SEBI Investor Awareness Initiative
- Check your KYC Status
- KYC Forms & FAQs
- Recieve your PIN
- A note on NIGO
- FAQs on RGESS
- FAQs on Direct Plan
- Receive Updates
- Share your views
- Transmission Checklist
- Equity Application Form
- Fixed Income Application Form
- Transaction Slip
- Factsheet May - 2016
- MF Tax Reckoner 2015
Follow Sundaram MF
More About Sundaram MF
POST A QUERY


