Nippon India ETF Nifty Next 50 Junior BeES
(Erstwhile Reliance ETF Junior BeES)
Fund House: Nippon India Mutual Fund| Category: ETFs |
| Launch Date: 21-02-2003 |
| Asset Class: Equity |
| Benchmark: NIFTY Next 50 TRI |
| TER: 0.17% As on (30-04-2025) |
| Status: Open Ended Schemes |
| Minimum Investment: 10,000 |
| Minimum Topup: 1,000 |
| Total Assets: 5,863.24 Cr As on 30-04-2025(Source:AMFI) |
| Turn over: 48% | Exit Load: Nil |
713.6554
-3.56 (-0.4982%)
14.16%
Benchmark: 20.72%
PERFORMANCE
Returns Type:
of :
Start :
End :
Period:
This Scheme
-
vs
NIFTY Next 50 TRI
-
Gold
-
PPF
-
Returns Type:
of :
Period:
Start :
Period:
Fund Multiplier
Time it would have taken to make your money double (2x), quadruple (4x) and quintuple (5x)
Time Taken To Multiply
2x
4x
5x
10x
FUND
13 Years 8 Months
FD
11 years 10 Months
GOLD
8 years 9 Months
NIFTY
5 years 5 Months
Investment Objective
The investment objective of Nippon India ETF Nifty Next 50 Junior BeES is to provide returns that, before expenses, closely correspond to the returns of Securities as represented by Nifty Next 50 Index. There can be no assurance or guarantee that the investment objective of the Scheme will be achieved.
Current Asset Allocation (%)
Indicators
| Standard Deviation | 16.75 |
| Sharpe Ratio | 0.97 |
| Alpha | 4.18 |
| Beta | 1.15 |
| Yield to Maturity | - |
| Average Maturity | - |
PEER COMPARISON
| Scheme Name | Inception Date |
1 Year Return(%) |
2 Year Return(%) |
3 Year Return(%) |
5 Year Return(%) |
10 Year Return(%) |
|---|---|---|---|---|---|---|
| Nippon India ETF Nifty Next 50 Junior BeES | 21-02-2003 | -0.33 | 26.75 | 20.25 | 23.22 | - |
| Mirae Asset Hang Seng TECH ETF | 06-12-2021 | 41.56 | 20.39 | 9.6 | - | - |
| Nippon India ETF Hang Seng BeES | 09-03-2010 | 35.36 | 17.48 | 10.12 | 5.26 | 3.74 |
| Mirae Asset NYSE FANG and ETF | 06-05-2021 | 35.26 | 39.65 | 41.8 | - | - |
| Tata Gold Exchange Traded Fund | 12-01-2024 | 32.28 | - | - | - | - |
Scheme Characteristics
Minimum investment in securities of a particular index (which is being replicated/ tracked) - 95% of total assets.
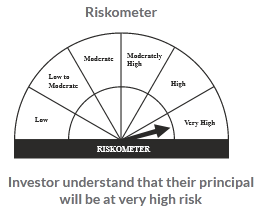
Riskometer
PORTFOLIO
Market Cap Distribution
Others
0.02%
Large Cap
90.2%
Mid Cap
9.78%