Nippon India MF Hybrid Funds: Good investment options in current market scenario

Market context
The equity market has corrected from the all the time highs. The rally in Chinese equities after the announcement of stimulus by the Government in Beijing has caused FIIs to shift their emerging market allocations from India to China. Escalating tensions in the Middle East has also dragged down the markets. From a medium to long term perspective, the beginning of a new interest rate cycle and India’s robust macro outlook – strong GDP growth forecast, narrowing fiscal deficit and stable Rupee is favourable for equities.
As far as bond market is concerned, easing bond yields and reduction in Government borrowing in FY 2024-25 has led to a bond rally. Change in RBI’s stance from "withdrawal of accommodation" to "neutral" and inclusion of Indian Government bonds in FTSE Russell Government Indexes has led to the bond rally getting extended and bond yields softening further. In the commodities market, cut in US interest rates and geo-political uncertainties is driving the rally in precious metals e.g. gold.
Valuations
Nifty Trailing Twelve Months PE ratio has crept up above its long term (10 year historical average). Valuations are over-stretched in certain pockets of the market despite the correction. In these market conditions, you should focus on asset allocation to add stability to your portfolio.
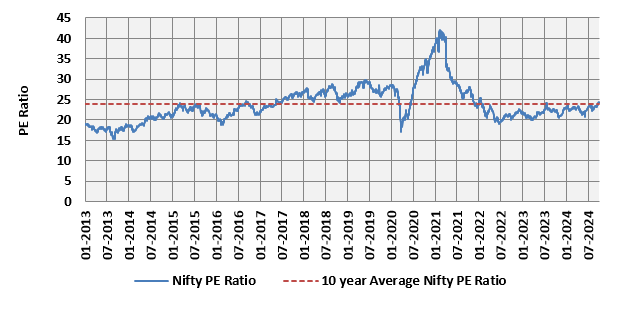
Source: National Stock Exchange, as on 30th September 2024
How asset allocation works in market cycles?
Different asset classes have low or even negative correlation of returns in different investment cycles (see the chart below). Diversifying your investment across asset class will bring stability to your portfolio and improve consistency i.e. if one asset class underperforms, the outperformance of another asset class will balance the risks.
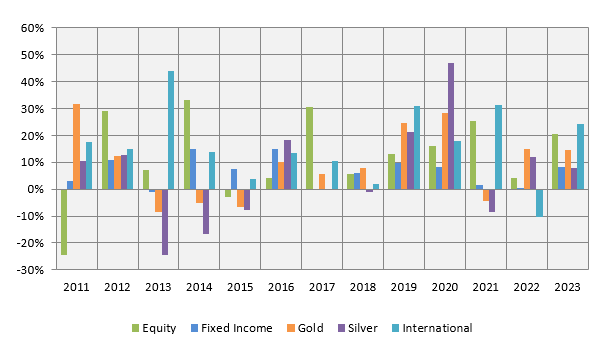
Source: NSE, MCX, MSCI, Investing.com. Equity is represented by Nifty 50 TRI, fixed income is represented by Nifty 10 year Benchmark G-Sec Index, gold by MCX spot prices, silver by MCX spot prices and international by MSCI World Index. MSCI World Index USD returns have been converted into INR returns by adjusting for INR versus USD appreciation or depreciation. Disclaimer: Past performance may or may not be sustained in the future
In this article we will discuss about 3 Nippon India Mutual Fund hybrid schemes that provide asset allocation solutions for investors of different risk profiles and investment needs.
Nippon India Balanced Advantage Fund
Also known as Dynamic Asset Allocation Funds, these funds dynamically manage their asset allocation; there is no upper or lower limit for equity or debt allocations. Nippon India Balanced Advantage Fund has been one of the consistent performers among Dynamic Asset Allocation or Balanced Advantage Fund (please see the most consistent balanced advantage funds).
The scheme uses an in-house proprietary dynamic asset allocation model which takes into consideration fundamental, technical and macro parameters:-
- Valuations: The model uses 1 year forward P/E. Valuations are fulcrum of the model.
- Trend following/momentum: This is a unique parameter which aids in maximizing Upside Potential and Limiting downside risk.
- Trade weighted US Dollar: A strong Dollar typically coincides with weaker phases of Equity prices, while a weaker Dollar coincides with strong equity performance.
- Global Demand Indicators: A combination of Lumber/Copper/Nickel prices acts as a strong indicator of global economy and markets.
The chart below shows the 1 year rolling returns of Nippon India Balanced Advantage Fund versus the Balanced Advantage Funds category average over the last 5 years. You can see that the fund was able to consistently outperform the category average. Performance consistency in different market conditions is in our view one of the most important performance parameters, because investors are looking for consistency and stability when they invest in Balanced Advantage Funds. The fund did not give negative returns and gave double digit returns in more than 60% of the instances (observations) in the last 5 years.
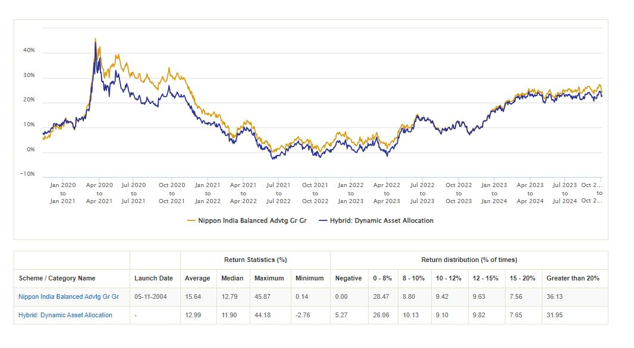
Source: Advisorkhoj Research
Nippon India Multi Asset Allocation Fund
Multi Asset Allocation Funds are mandated by SEBI to invest in at least 3 or more asset classes. Minimum allocation to each asset class will be 10%. Nippon India Multi Asset Allocation Fund is a "true to label multi asset fund" as it invests in 4 asset classes:-
- Equity Allocation - Multi Cap investment strategy, blend of growth and value stocks, large cap bias, focus on alphas creation through stock selection.
- Debt Allocation - Debt portfolio is managed with a moderate duration; duration range of 1.25 – 2.25 years, predominantly invest in high credit quality assets, focused on Accrual Income.
- Commodities allocation – The fund invests in Exchange Traded Commodity Derivatives (ETCDs). Maximum commodity exposure will be 20%. Minimum 10% investment in gold through ETFs / ETCDs. 5 – 10% exposure to other commodities.
- Overseas equity allocation - Investment across geographies through investment in MSCI World Index. Overseas equities could act as an effective diversification tool as well as benefit from any currency depreciation. The fund has stopped investments in overseas securities with effect from 1st April 2024 as per SEBI’s mandate.
The fund was launched in August 2020 and is among the Top 3 Multi Asset Allocation Funds. Nippon India Multi Asset Fund is one the very few multi asset allocations funds which has allocations to international equities.
The chart below shows the 1 year rolling returns of Nippon India Multi Asset Allocation Fund versus the Multi Asset Allocation Funds category average since the inception of the fund. You can see that the fund was able to consistently outperform the category average over the last 2 – 2.5 years. Though this fund was slightly more volatile than the Balanced Advantage Fund, it was able to give 12%+ CAGR returns in more than 65% of the instances (observations) across different market conditions since its inception.
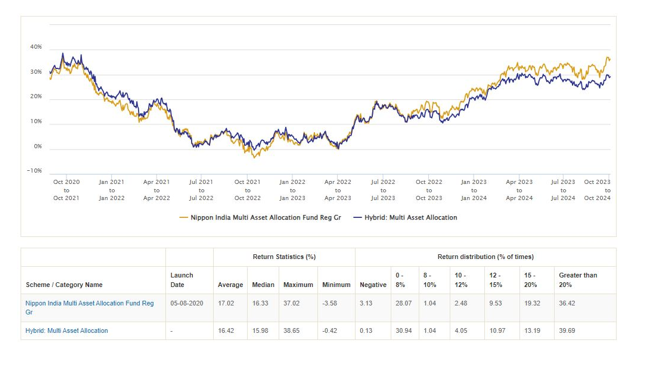
Source: Advisorkhoj Research
Nippon India Equity Savings Fund
Equity savings funds can partially hedge their equity allocation using derivatives, while maintaining gross equity allocation of at least 65% - thus these funds enjoy equity taxation. These funds must invest at least 10% of their assets in debt and money market instruments. The asset allocation of Nippon India Equity Savings Fund is as follows:-
- Equity Allocation – The active equity (unhedged equity) allocation of the fund can range from 25 – 40%. The equity portion will have high active share (minimum 60%) and have a large cap bias (minimum 65%). It invests across industry sectors.
- Arbitrage Allocation – The fund allocates 25 – 70% to arbitrage opportunities. Arbitrage allocation reduces risk and ensures equity taxation for the fund.
- Debt allocation – The debt allocation of the fund can range from 10 – 35%. The modified duration of the debt portion is maintained between 2 – 4 years (moderate interest rate risk). The credit quality is high.
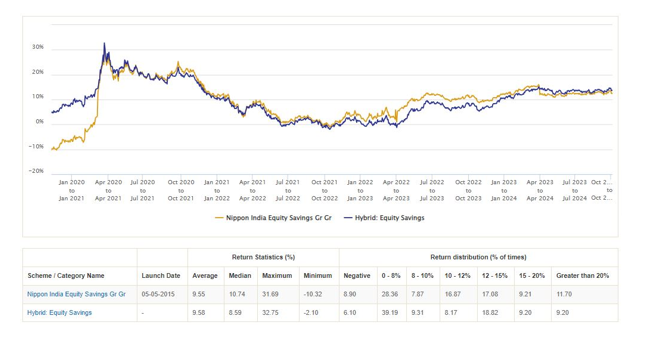
The chart below shows the 1 year rolling returns of Nippon India Equity Savings Fund versus the Equity Savings Funds category average over the last 5 years. You can see that the fund was able to consistently outperform the category average for most of the time. Though the volatility of the fund is slightly higher on a relative basis (relative to the category), the fund was able to gave double digit returns in 57% of the instances (observations) in the last 5 years.
Source: Advisorkhoj Research
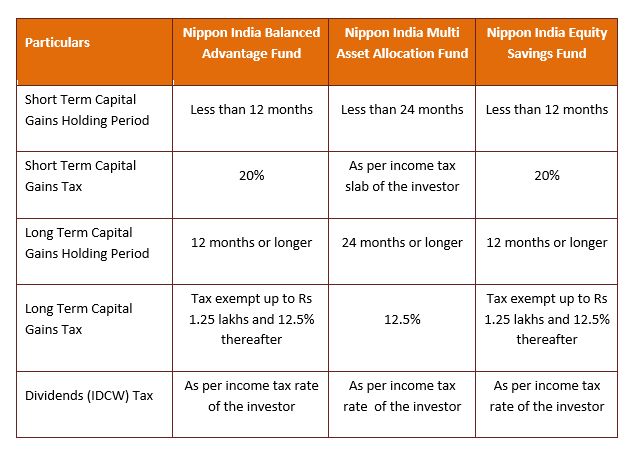
Taxation
Risk Profile

Who can invest?
- Investors looking for capital appreciation over long investment horizons.
- Investors who want to reduce portfolio volatility by diversifying across multiple asset classes.
- Investors with minimum 3 – 5 years investment tenure.
- Investors with moderately high to high-risk appetites.
- You can select Nippon India Equity Savings, Balanced Advantage and Multi Asset Allocation Funds depending on your risk appetite. You can also invest in a combination of 2 or more funds.
Investors should consult their financial advisors or mutual fund distributors which Nippon India MF hybrid fund will be suitable for their investment needs.
Mutual Fund Investments are subject to market risk, read all scheme related documents carefully.
Queries
-
What is the benefit of mutual fund STP
Aug 29, 2019
-
How much to invest to meet target amount of Rs 2 Crores
Aug 26, 2019
-
Can I achieve my financial goals with my current mutual fund investments
Aug 24, 2019
-
Can you tell me return of various indices
Aug 19, 2019
-
What would be the post tax return on different investments
Aug 18, 2019
-
Which Principal Mutual Fund scheme will be suitable for my retirement corpus
Aug 16, 2019
-
What is the minimum holding period for availing NCD interest
Aug 4, 2019
Top Performing Mutual Funds
Recommended Reading
Fund News
-
Axis Mutual Fund joins ONDC Network to Expand Access to Mutual Fund Investments
Apr 18, 2025 by Axis Mutual Fund
-
Nippon India Mutual Fund launches Nippon India Nifty 500 Quality 50 Index Fund
Apr 18, 2025 by Advisorkhoj Team
-
Nippon India Mutual Fund launches Nippon India Nifty 500 Low Volatility 50 Index Fund
Apr 18, 2025 by Advisorkhoj Team
-
RBI Monetary Policy: RBI changes policy stance and lowers rate
Apr 9, 2025 by Axis Mutual Fund
-
Kotak Mahindra Mutual Fund launches Kotak Nifty Top 10 Equal Weight Index Fund
Apr 7, 2025 by Advisorkhoj Team


