HDFC Flexicap Fund: One of the biggest wealth creators of all times in Indian mutual funds

Wealth creator over nearly 3 decades
HDFC Flexicap Fund, erstwhile HDFC Equity Fund, has a wealth creation track record of over 28 years. The fund was launched in 1995 and is among the oldest diversified equity funds in India. Rs 10,000 invested in the fund at the time of its inception would have grown to more than Rs 13 lakhs as on 31st July 2023 (see the chart below). The CAGR returns since inception of the fund is 18.6%.
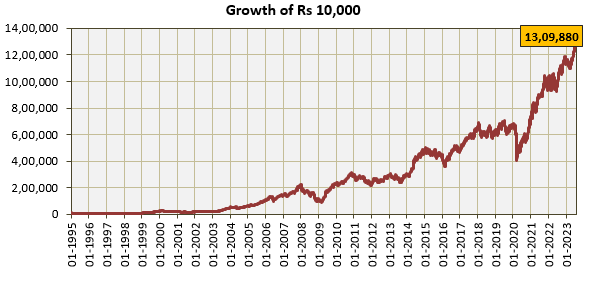
Source: Advisorkhoj Research, as on 31st July 2023. Disclaimer: Past performance may or may not be sustained in the future
The Systematic Investment Plan (SIP) return of the fund is also a great wealth creation story. If you had invested Rs 10,000 per month (cumulative investment of Rs 34.4 lakhs) in the HDFC Flexicap Fund through a hypothetical SIP you could have accumulated Rs 14.3 crores. The SIP XIRR since inception is around 21% (as 31st July 2023).
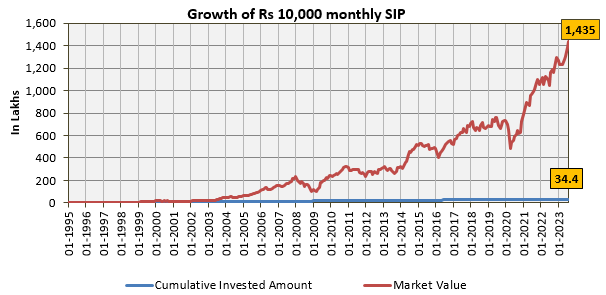
Source: Advisorkhoj Research, as on 31st July 2023. Disclaimer: Past performance may or may not be sustained in the future
Outperformed the benchmark by big margin
The chart below shows the growth of Rs 10,000 investment in HDFC Flexicap Fund versus the benchmark Nifty 500 TRI since till 1st January 1999. We are starting with 1st January 1999 since Nifty 500 TRI was launched in November 1998. You can see that the outperformance of HDFC Flexicap Fund relative to the benchmark index is phenomenal. The fund was able to create nearly 3.5X (3.5 times) wealth compared to the benchmark index- Rs 14.1 lakhs versus Rs 4.0 lakhs. This visual of the chart may create an impression that Nifty 500 TRI did not perform well in this period. If you do the math, you will see that Nifty 500 TRI did extremely well, giving 16% CAGR returns; it is just that the CAGR return of HDFC Flexicap was outstanding at 22%. You can see the power of compounding over long investment tenures in action here; a 6% difference in CAGR returns created nearly 3.5 times more wealth.
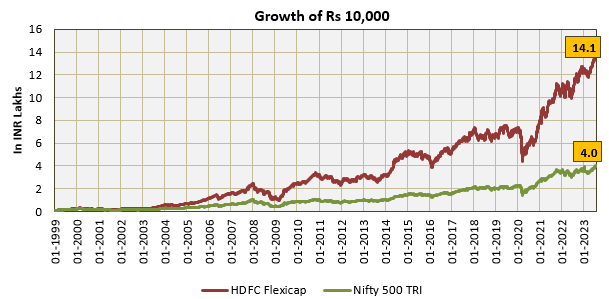
Source: Advisorkhoj Research, as on 31st July 2023. Period: 1/1/1999 to 30/06/2023. Disclaimer: Past performance may or may not be sustained in the future
Outperformance across different investment tenures
The chart below shows the CAGR returns of the fund over different investment tenures ending 30th June 2023. You can see that the scheme outperformed the benchmark across different time-scales.
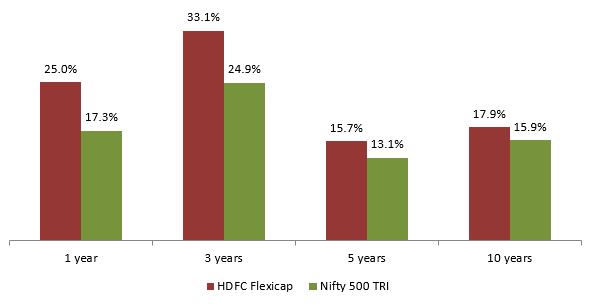
Source: Advisorkhoj Research, as on 31st July 2023. Disclaimer: Past performance may or may not be sustained in the future
Rolling Returns
Some investors argue that point to point returns are biased by the performance of a fund in prevailing market conditions. To avoid that bias we are comparing the 3 year rolling returns (rolled daily) of HDFC Flexicap Fund versus the benchmark index Nifty 500 TRI since 1st January 1999, which almost coincides with the inception of Nifty 500 TRI. We have chosen 3 year rolling period because investors should have minimum 3 year investment tenures for equity funds. You can see that the fund outperformed the benchmark index with fairly high degree of consistency (see the chart below). You can also see in the table below the chart that the fund was able to provide better downside risk limitation relative to the benchmark and at the same time was able to give 15%+ returns more consistently than the benchmark.
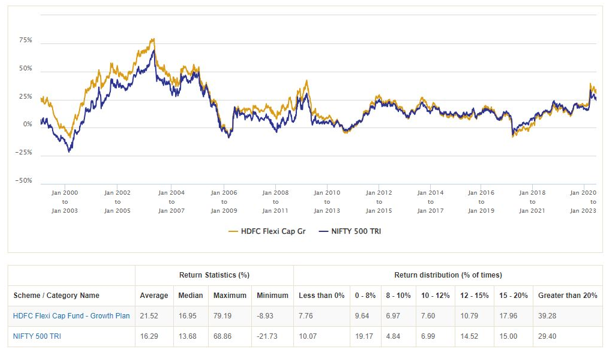
Source: Advisorkhoj Research, as on 31st July 2023.. Period: 1/1/1999 to 31/07/2023. Disclaimer: Past performance may or may not be sustained in the future
The rolling returns outperformance consistency of HDFC Flexicap Fund is testimony of the quality of fund management. Long continuity of the fund manager and stock selection strategy are, in our opinion, the most important factors for the outstanding performance of this fund. A more careful examination of the rolling returns chart may reveal that fund underperformed at times e.g. 2013 to 2016 and again in 2019 and 2020, but the fund was always able to bounce back.
Bounce back in performance
The chart below shows the quartile performance of HDFC Flexicap Fund relative to its peers in the Flexicap category on an annual basis over the last 10 years or so. The boxes in shades of green denote ranking in the top 2 quartiles, while the boxes in shades of red denote ranking in the bottom 2 quartiles. The bounce back of HDFC Flexicap Fund’s performance from red to green in the chart below tells you that a fund manager’s strategy may underperform in certain market conditions. However if you have long investment tenures, you give your fund the time it requires to bounce back and create returns for you.

Source: Advisorkhoj Research, as on 31st July 2023. Disclaimer: Past performance may or may not be sustained in the future
About HDFC Flexicap Fund
The fund was launched in 1st January 1995 and is one of the most popular actively managed equity funds in India, with AUM of over Rs 38,266 Crore (as on 31st July 2023). The total expense ratio (TER) of the scheme is 1.61%. The portfolio turnover of the scheme is fairly low at 39%. The fund invests across market cap segments and industry sectors. The fund currently has a large cap bias (more than 80%) of the portfolio. From 2003 to 2022 the fund was helmed by industry veteran Prashant Jain. Prashant followed value based investment style with contra investment calls which produced outstanding returns for investors over long investment tenures (as shown above). Since Prashant’s retirement in 2022, Roshi Jain has taken over the management of this fund. Her investment style is quite similar to Prashant. In addition to HDFC Flexicap, Roshi is also managing HDFC Tax Saver Fund and HDFC Focused 30 Fund.
Why invest in Flexicap Funds?
- Flexicap funds have no upper or lower limits with respect to allocations to any market cap segment. The fund managers can invest any percentage of their assets in any market cap segment viz. large cap, midcap and small cap.
- Flexicap fund managers have the ability to create alphas by investing judiciously in midcaps and small caps. Since small and midcaps are relatively under-researched compared to large caps, their price discovery is not as efficient as large caps. Fund managers may be able to find quality mid and small cap stocks at attractive valuations creating alphas for investors.
- At the same time, flexicap fund managers have flexibility of shedding risks in unfavourable or volatile market conditions limiting downside risks for investors.
- Flexicap Funds are ideal for investors who are not able to decide how much allocations they should have towards each market cap segments. They can rely on the expertise of the fund manager to do the market cap allocations.
Why invest in HDFC Flexicap Fund?
- From a long term perspective, the growth outlook for Indian equities is extremely positive. Indian economy is in a structural up cycle. Corporate and bank balance sheets are now in best possible shape to drive capex and credit respectively
- The Government is focused on driving growth through direct investments in budget as well as through reforms like GST, lower corporate tax and ease of doing business, PLIs for import substitution or export ecosystem creation
- Favourable demographics, rising affluence, shift from unorganized sectors to organized and benefits accruing out of global supply chain realignment e.g. China + 1 will be beneficial for Indian equities
- HDFC Flexicap Fund has a strong track record of wealth creation across investment cycles. The investment strategy of the fund has created alphas for investors over long investment horizons.
- The investment style and strategy of the new fund manager is fairly consistent with the long term investment style of this fund. This gives us confidence that the fund will be able to maintain continuity in its stellar long term track record.
Who should invest in HDFC Flexicap Fund?
- Investors looking for capital appreciation over long-term investment horizon
- Investors with high risk appetites
- Investors with minimum 5 years investment tenures
- You can invest either in lump sum or through SIP
Investors should consult with their financial advisors if HDFC Flexicap Fund is suitable for their investment needs.
Mutual Fund Investments are subject to market risk, read all scheme related documents carefully.
Queries
-
What is the benefit of mutual fund STP
Aug 29, 2019
-
How much to invest to meet target amount of Rs 2 Crores
Aug 26, 2019
-
Can I achieve my financial goals with my current mutual fund investments
Aug 24, 2019
-
Can you tell me return of various indices
Aug 19, 2019
-
What would be the post tax return on different investments
Aug 18, 2019
-
Which Principal Mutual Fund scheme will be suitable for my retirement corpus
Aug 16, 2019
-
What is the minimum holding period for availing NCD interest
Aug 4, 2019
Top Performing Mutual Funds
Recommended Reading
Fund News
-
DSP Mutual Fund launches DSP Nifty Next 50 ETF
Dec 19, 2025 by Advisorkhoj Team
-
DSP Mutual Fund launches DSP Nifty 500 Index Fund
Dec 19, 2025 by Advisorkhoj Team
-
Kotak Mahindra Mutual Fund launches Kotak Nifty Next 50 ETF
Dec 18, 2025 by Advisorkhoj Team
-
The Wealth Company Mutual Fund launches The Wealth Company Gold ETF
Dec 16, 2025 by Advisorkhoj Team
-
Axis Mutual Fund launches Axis Gold and Silver Passive FOF
Dec 10, 2025 by Advisorkhoj Team


