Has the stock market rally come to a halt

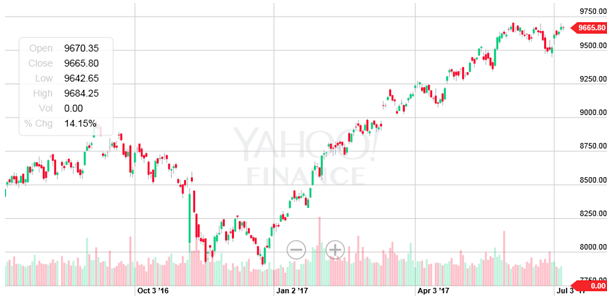
Indian equity market saw a fantastic rally over the past 12 months. The rally in the last 6 months was quite spectacular (as can be seen in the Nifty 50 chart below); in the last 6 months the Nifty gave over 17% returns.

Source: Yahoo Finance
Given the momentum seen in the first 4 months of this year, one would have expected Nifty to be near 10,000 levels now. But over the past one month, Nifty has been struggling to break the crucial 9,700 level. Different experts have different views on the market, which may leave the average investor confused. Some experts suggest that, Nifty is in a consolidation phase now and they do not see a breakout from the current levels in the near future. Others suggest that, a correction may be in the horizon. In this blog post, we will try to analyze what is happening in the market both from technical and fundamental perspectives.
Technical Perspective
Let me say upfront that I am not a huge fan of technical analysis. Most academicians reject technical analysis because it tries to forecast stock prices based on past price and volume movements; it does not take into account developments inside the companies or in the concerned industry sectors, which fundamental analysis does. In our view fundamental analysis does a better job of predicting stock prices in the long term. However, in the short term, stock prices are a function of demand and supply. In absence of any new economic information about a stock, price / volume data can explain the pattern of demand and supply.
The famous investor Peter Lynch once said that, technical analysis does a great job predicting the past. He would have made that quote sarcastically, but we will use technical analysis, as Lynch said, to explain the market price behaviour over the past one month. You can see in the chart above that, in the past one month Nifty was range-bound between 9,500 and 9,700. This implies that, when Nifty was near 9,700, supply exceeded demand and the price did not go up. But we also see that, Nifty did not fall below 9,500, which implies that at 9,500 levels demand exceeded supply.
To understand better what is happening in the market, look at the chart below.

Source: Yahoo Finance
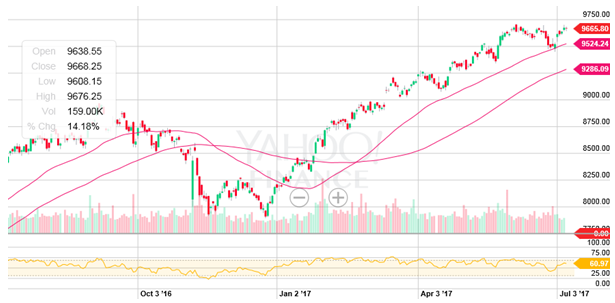
Let us first focus our attention on the pink lines. These are daily moving average (DMA) lines. Readers, who have read our technical posts, would be familiar with DMAs, but in interest of other readers, DMA is the daily moving average of the asset prices over a certain rolling period. For example, the 50 DMA of Nifty is the daily moving average of Nifty over the last 50 days. DMA shows the market trend. The upper pink line in the chart is 50 day moving average. The 50-day moving average is a short term support (demand exceeds supply at support levels) for the market. The 50 day moving average is 9,524. This level will act as support for Nifty. The lower pink line in the chart is the 100 day moving average. Technical analysis theory also says that, if the shorter term DMA is more than the longer term DMA then the market trend is bullish. Since the 50 day moving average line is higher than 100 day moving average, we can say that the intermediate term market trend is bullish.
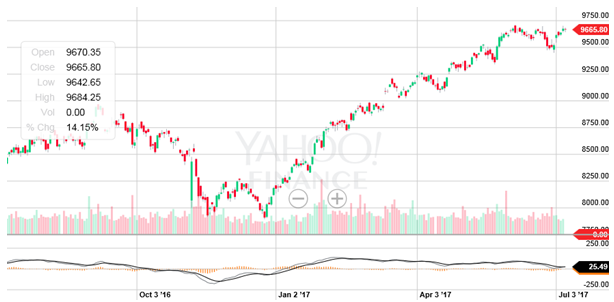
One problem, I have with DMA is that, it is a lagging indicator. You can see that, the 50 DMA and 100 DMA cross-over took place in February, whereas the market has been rallying since January. Therefore, in my view, DMA is not very useful trading, but it can be used to confirm a trend. A more useful technical tool in my view is the momentum oscillators. In this post, for the benefit of our readers we will use a simple momentum oscillator, the Moving Average Convergence Divergence (abbreviated as MACD) Oscillator. The analytics of MACD is a little complex and outside the scope of this post; for readers, who are not familiar with MACD, suffices to say that, in very simple terms, MACD is a momentum indicator. Without going into technical details of MACD, all you need to know is that, MACD gives momentum signals using two lines, the MACD line and the signal line. These lines are shown at the bottom the chart below.

Source: Yahoo Finance
The darker line at the bottom of the chart is the Signal line and lighter line is the MACD line. If the MACD line crosses below the signal line, it indicates weak momentum or downward momentum. If MACD crossed above the signal line, it indicates positive momentum. If you carefully observe the lines at the bottom of the chart, you will see that, the MACD fell below the signal line a few weeks back (this was in June 14), signifying weaker momentum going forward in the short term. That is why from the middle of June onwards, Nifty has been struggling to break 9,700.
While the MACD is signalling weak momentum (may even be giving sell signals to technical traders for the past few days), the 50 and 100 DMAs are telling us that, the intermediate term market trend is still bullish. The market is simply going through a consolidation phase. From a technical perspective, the crucial level is 9,700 on the Nifty. If Nifty gives a breakout from 9,700 then it is very likely that, the upward momentum can resume again. Long term investors should simply be patient and see how things pan out in the economy and market.
How will Nifty break the 9,700 level?
As discussed earlier, technical analysis does a decent job of explaining demand and supply behaviour in relationship to prices in the short term. In the real world, assuming everyone has the same information about the market and economy, the demand and supply pattern will not change, unless we have new information about the market and economy. That is why I like to use technical analysis in combination with fundamental analysis. Since the market has been range-bound between 9,500 and 9,700, we think that it will continue to remain that range unless we have new information or news.
The new information can come in form of the US Fed monetary policy meeting, our RBI monetary policy meeting, IIP data, effect of monsoon, effect of GST roll-out, quarterly earnings, so on so forth. All these developments and its effects thereof are in the domain of fundamental analysis. The FY 2018 Q1 earnings are due in the next few weeks. The earnings will have an impact on the market, positive or negative. We will also have to see how other global and domestic developments affect the market. If and when, Nifty breaches 9,700 it is likely to rally further to much higher levels, positive conditions supporting. Till then, we have to wait.
Fundamental Perspective
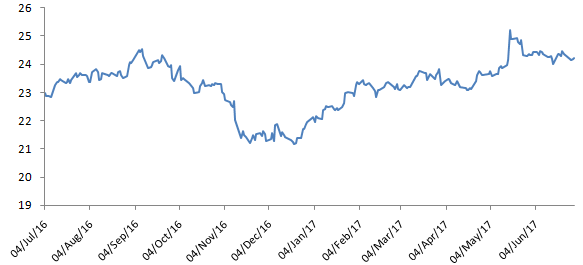
Valuations have been a concern in the market over the past 3 – 4 months. The chart below shows the Nifty P/E ratios over the past 12 months.

Source: National Stock Exchange
You can see that, the Nifty P/E ratio started expanding from December 2016 and reached a multiple of around 25 by May. When the Nifty P/E ratio crosses 23 or 24, investors get concerned about valuations getting over-heated. In the past one year, Nifty rallied around 16%, while the P/E ratio expanded 5%. This implies that, the earnings (EPS) growth was much below 15 – 16%, closer to 11 – 12%. Bullish analysts expect 19 – 20% EPS growth. It is, therefore, not surprising that this consolidation was due.
In fact, purely going by valuations, one would have expected a bigger cut in the index, but favourable factors like Government reforms (e.g. GST), monsoon etc provided a bit of support. If we get good earnings growth in Q1 (results due in a few weeks), Nifty valuations may again look reasonable and the market may start to rally again.
Conclusion
Can we get 20% EPS growth as many investors / analysts are expecting? Earnings are showing signs of picking up, but 20% EPS growth may still be some distance away. However, other favourable factors like reforms, effect of monsoon or inflation and rural consumption, lower interest rates, favourable global macro developments etc can still propel the market to higher highs, provided earnings growth is on an improving trajectory. Our economy is going through a structural transformation and the world is bullish on India. In this post, we examined some technical and fundamental factors related to the equity market. We can conclude that, for long term investors, Indian equities can generate excellent capital appreciation.
Mutual Fund Investments are subject to market risk, read all scheme related documents carefully.
Queries
-
What is the benefit of mutual fund STP
Aug 29, 2019
-
How much to invest to meet target amount of Rs 2 Crores
Aug 26, 2019
-
Can I achieve my financial goals with my current mutual fund investments
Aug 24, 2019
-
Can you tell me return of various indices
Aug 19, 2019
-
What would be the post tax return on different investments
Aug 18, 2019
-
Which Principal Mutual Fund scheme will be suitable for my retirement corpus
Aug 16, 2019
-
What is the minimum holding period for availing NCD interest
Aug 4, 2019
Top Performing Mutual Funds
Recommended Reading
Fund News
-
DSP Mutual Fund launches DSP Nifty Next 50 ETF
Dec 19, 2025 by Advisorkhoj Team
-
DSP Mutual Fund launches DSP Nifty 500 Index Fund
Dec 19, 2025 by Advisorkhoj Team
-
Kotak Mahindra Mutual Fund launches Kotak Nifty Next 50 ETF
Dec 18, 2025 by Advisorkhoj Team
-
The Wealth Company Mutual Fund launches The Wealth Company Gold ETF
Dec 16, 2025 by Advisorkhoj Team
-
Axis Mutual Fund launches Axis Gold and Silver Passive FOF
Dec 10, 2025 by Advisorkhoj Team


