DSP BlackRock Dynamic Asset Allocation Fund: Superior returns with moderate risk

An asset allocation fund invests in a fixed or dynamic mix of three main asset classes, equity, debt and cash equivalents. In a fixed asset allocation fund, the asset allocation percentages of equity, debt and cash equivalents are fixed. The fund manager rebalances the asset mix if it deviates from the fixed asset allocation percentages. In a dynamic asset allocation fund, the asset allocation percentages change with changes in market conditions.
In our post, Asset Rebalancing will reduce your portfolio risk and improve returns, we had shown that asset re-balancing with fixed asset allocation percentages reduces portfolio risk and gives superior risk adjusted returns. In the same post, we had also said that, we can get even better returns, if asset re-balancing is done based on relative valuations of asset classes.
In our blog post, Valuation Matters: How can you use valuations to make better investment decisions, we demonstrated analytically that investors got superior returns, when investing at lower valuations.
Dynamic Asset Allocation funds, as the name suggests, dynamically rebalance their asset mix, based relative valuations of asset classes. Different dynamic asset allocation funds have different dynamic portfolio rebalancing strategies, but what is appealing about DSP BlackRock Dynamic Asset Allocation Fund’s dynamic rebalancing strategy is that, it is simple, yet very elegant. At the heart of the DSP BlackRock Dynamic Asset Allocation Fund’s dynamic rebalancing strategy is simple yet powerful analytical factor known as the yield gap.
What is Yield Gap?
There are a number of analytical definitions of yield gap, but leaving the mathematics aside for the moment (we will discuss it later), yield gap is nothing but the ratio of the debt market yield and the equity market yield. If the yield gap is high it means that the equity market is overpriced relative to the debt market, which is a signal for the portfolio to be more weighted towards debt.
On the other hand if the yield gap is low, it means that the equity market is underpriced, which is a signal for increased allocations to equity. DSP BlackRock Dynamic Asset Allocation Fund uses yield gap, to dynamically determine the asset allocation of debt and equity in the portfolio. In effect the fund aims to time the market by buying assets at the optimal valuation.
Fund Overview
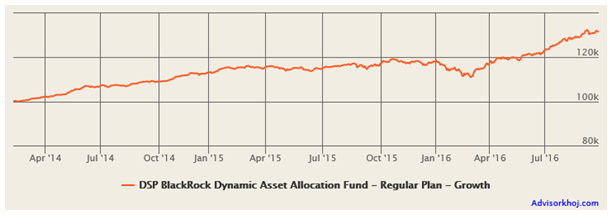
DSP BlackRock Dynamic Asset Allocation Fund was launched in February 2014. It has र 1,000 crores of assets under management. Investors should note that, DSP BlackRock Dynamic Asset Allocation Fund is a fund of funds. Therefore, from a tax perspective, it is treated as a debt fund. The expense ratio of the fund is 1.85%. The fund managers of this scheme are Mayur Patel, Kedar Karnik and Laukik Bagwe. The benchmark of the fund is the CRISIL Balanced Fund Index. From a risk perspective, this fund has a moderate risk profile. As such, the fund may be suitable for investors, with moderate risk tolerance, looking for income and capital appreciation over a sufficiently long investment horizon. The chart below shows the growth of र 100,000 lump sum investment in DSP BlackRock Dynamic Asset Allocation Fund.

Source: Advisorkhoj Research
The chart above shows why DSP BlackRock Dynamic Asset Allocation Fund is good investment option for investors with moderate risk profiles. You can see that, despite the sharp correction in equity markets in 2015, the fund value of DSP BlackRock Dynamic Asset Allocation Fund was quite stable in 2015, unlike most diversified equity funds. The fund value dipped slightly (about 5%) in the early part of 2016 (January and February), but our readers, who follow the market, know that, early 2016 was terrible time for stock markets, with the Nifty falling 25% in two months. The dynamic portfolio rebalancing strategy of DSP BlackRock Dynamic Asset Allocation Fund paid off after March, with returns of 18% in the last 6 months or so.
Portfolio Composition
As per its investment strategy, DSP BlackRock Dynamic Asset Allocation Fund can invest between 10 to 90% in equity and similarly between 10 – 90% in debt. Currently the allocation to debt investment is about 55%, while the allocation to equity is about 43%. Cash equivalents account for the balance allocation. Since the DSP BlackRock Dynamic Asset Allocation Fund is a fund of funds, it does not directly invest in securities but in equity and debt mutual fund schemes of DSP BlackRock. Currently the fund has invested in DSP BlackRock Strategic Bond Fund, DSP Black Rock Money Manager Fund and DSP BlackRock Short Term Fund for the debt portion. For the equity portion the fund has invested in DSP BlackRock Equity Fund and DSP BlackRock Top 100 Fund.
The chart below shows the portfolio holdings of the DSP BlackRock Dynamic Asset Allocation Fund.

Source: Advisorkhoj Research
However, investors should note that in future the fund can invest in other DSP BlackRock equity and debt mutual fund schemes of DSP BlackRock Mutual Fund.
Yield Gap Model Demystified
As discussed earlier, yield gap is the ratio of the debt market yield and equity market yield. The parameter used for debt market yield is the 10 year Government Bond (10 year G-sec) yield. The parameter used for equity market yield is nothing but the reciprocal of the price earnings ratio (PE ratio); in conceptual terms, the earnings of the Nifty as percentage of the price of Nifty.

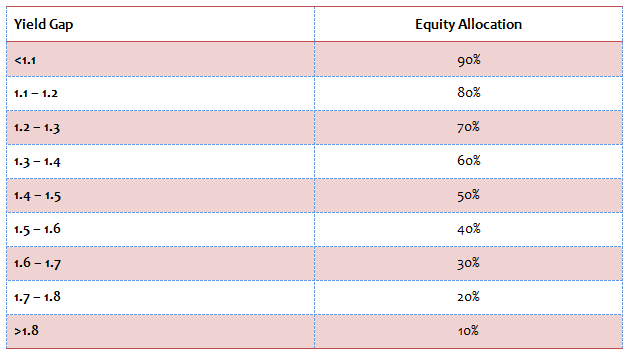
If the yield gap is in the range of 1.4 – 1.5 the asset allocation is 50% debt and 50% equity. If yield gap is lower the allocation to equity his higher and vice versa. DSP BlackRock uses the following allocation bands for the debt and equity allocation of DSP BlackRock Dynamic Asset Allocation Fund.

Source: DSP BlackRock
In addition to the yield gap factor to determine asset allocation, DSP BlackRock also uses a modification of the yield gap. The modified yield gap is the ratio of 1 year G-sec to Nifty earnings yield.
How robust is the yield gap model?
DSP BlackRock has back-tested the model from 2000 and compared the returns with Nifty and the CRISIL Balanced Fund Index. The model has generated better returns than both Nifty and CRISIL Balanced Fund Index across various investment periods. Longer the investment horizon, higher has been the outperformance versus the benchmark. The yield gap model has also outperformed P/E based asset allocation model. The model increases equity allocation from 2001 to 2006 and then reduces it to the lowest level by January 2008. This was the time when the market was at its peak. The model again increases its equity allocation through the bear market of 2008. The back-testing shows that the model worked correctly in terms of timing the market.
How has yield gap model worked in the last 2 years?
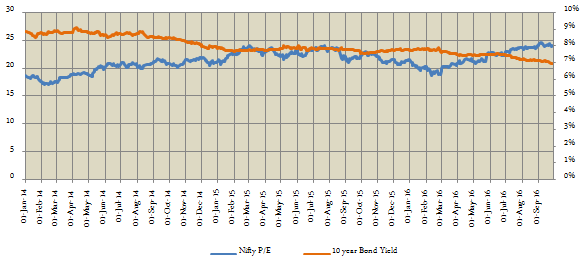
The chart below shows the Nifty P/E ratio and 10 year Government bond yield from 2014 to date (September 28, 2016).

Source: National Stock Exchange, Investing.com
Let us now compare Nifty yield (inverse of Nifty P/E ratio) with 10 Government Bond yield.

You can see that, throughout 2014 and the first half of 2015, the 10 year Government bond yield was significantly higher than Nifty yield, justifying maximum allocations to debt. However, from August / September 2015, Nifty yields started converging towards the 10 year yield, suggesting higher allocations to equity.
The yield gap (ratio of 10 year Government Bond yield and Nifty Yield) was in the range of 1.7 to 1.8 (sometimes even higher) after the NDA won the 2014 elections, suggesting very high allocations to debt, as per DSP BlackRock Dynamic Asset Allocation Fund dynamic rebalancing model (as per the table above).
However, by September 2015, the yield gap was below 1.7, suggesting shift in asset mix towards equity (as per the table above). In January 2016, the yield gap was below 1.6, suggesting 40% allocation to equities. In February the yield gap was even below 1.5, suggesting 50% allocation. The incremental allocation to equities paid off, as we saw earlier. The current yield cap is around 1.6, which explains the current portfolio composition discussed earlier in this post.
Dividend Track Record
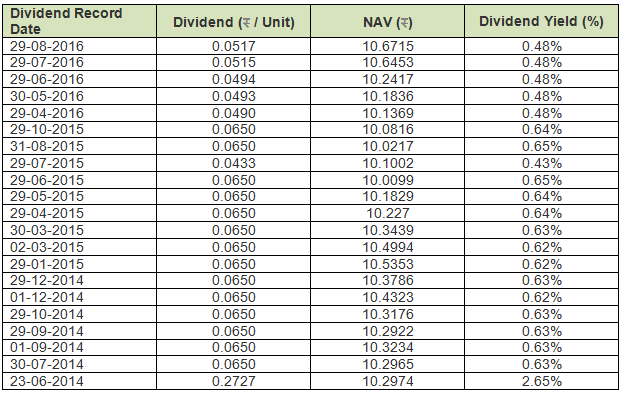
DSP BlackRock Dynamic Asset Allocation Fund (Monthly Dividend Option) has a good monthly dividend pay-out track record over the past two years. The table below shows the monthly dividend history of the fund.

Source: Advisorkhoj Historical Dividends
The average annual dividend yield is 7.7%.
Conclusion
The fund had over 80% to debt in 2014 (when equity valuations were high), but over the past year or so, the equity allocation of the fund has increased to over 40% (taking advantage of the sharp correction in 2015 and early 2016).
This change of asset allocation of the fund over the last two and half years makes intuitive sense and is a validation of the robustness of the fund’s strategy. While studies have shown that, asset allocation is the most important driver of a portfolio’s relative performance, the underlying schemes of DSP BlackRock Dynamic Asset Allocation Fund are good mutual fund schemes.
Earlier this year, we had reviewed DSP BlackRock Top 100 Fund and DSP BlackRock Strategic Bond Fund (you can read the fund reviews by clicking on the link). Investors should understand that portfolio rebalancing strategy of DSP BlackRock Dynamic Asset Allocation Fund is set up for moderate investment risk. Based on our experience of equity market valuations in India, only in rare market circumstances, the equity allocation of this fund will exceed 60 or 70%.
However, the portfolio strategy of this fund ensures that, the investor will buy equity at attractive prices. The elegance of the fund strategy can give investors with moderate risk profiles, good returns for the risk they are taking. Investors who want regular cash-flows from their investment can consider investing in the monthly dividend option of this fund. Investors should consult with their financial advisors, if DSP BlackRock Dynamic Asset Allocation Fund is suitable for their investment needs.
Mutual Fund Investments are subject to market risk, read all scheme related documents carefully.
Queries
-
What is the benefit of mutual fund STP
Aug 29, 2019
-
How much to invest to meet target amount of Rs 2 Crores
Aug 26, 2019
-
Can I achieve my financial goals with my current mutual fund investments
Aug 24, 2019
-
Can you tell me return of various indices
Aug 19, 2019
-
What would be the post tax return on different investments
Aug 18, 2019
-
Which Principal Mutual Fund scheme will be suitable for my retirement corpus
Aug 16, 2019
-
What is the minimum holding period for availing NCD interest
Aug 4, 2019
Top Performing Mutual Funds
Recommended Reading
Fund News
-
Kotak Mahindra Mutual Fund launches Kotak Energy Opportunities Fund
Apr 3, 2025 by Advisorkhoj Team
-
Groww Mutual Fund launches Groww Nifty 500 Momentum 50 ETF FOF
Apr 3, 2025 by Advisorkhoj Team
-
Groww Mutual Fund launches Groww Nifty 500 Momentum 50 ETF
Apr 3, 2025 by Advisorkhoj Team
-
ICICI Prudential Mutual Fund launches ICICI Prudential Nifty EV and New Age Automotive ETF FOF
Mar 28, 2025 by Advisorkhoj Team
-
UTI Mutual Fund launches UTI Income Plus Arbitrage Active Fund of Fund
Mar 21, 2025 by Advisorkhoj Team


