Canara Robeco Balanced Advantage Fund NFO: Good investment in current market conditions

Canara Robeco MF is launching a Balanced Advantage Fund. The New Fund Offer (NFO) has opened for subscription on 12th July and close on 26th July. The fund will follow a dynamic asset allocation model. In this article, we will review this Canara Robeco Balanced Advantage Fund NFO.
Current Market Context
The market is trading at record highs after the formation of the new Government at the centre. With expectations of political stability and policy continuity the momentum in the market is strong, not just with respect to the headline indices but also the broader market. However, sustained bull markets and record highs inevitably, raise concerns about valuations. Investors who are sitting on profits or investors sitting on the sidelines can get confused about their course of action. Timing the market is always very difficult. Instead of trying to time the market, investors should focus on asset allocation. Asset allocation plays an important role in bringing stability to investors’ portfolios. Balanced advantage funds which manage asset allocation to equity and fixed income dynamically based on market conditions can be suitable investment options.
Market cycles are inevitable
Equity as an asset class has wealth creation potential in the long term, but equity markets are subject to business cycles – there will be periods of rising and falling markets (see the growth of Nifty 50 TRI since 1st January 2000 in the chart below). In rising markets, valuations keep increasing till we reach a point where valuations become very expensive. When correction comes (circled in red), we see sell-off from and prices come down, till we get to a point where valuations start becoming attractive. At this point of time, the market bottoms out and market starts rising again. This cycle keeps repeating over and over again.
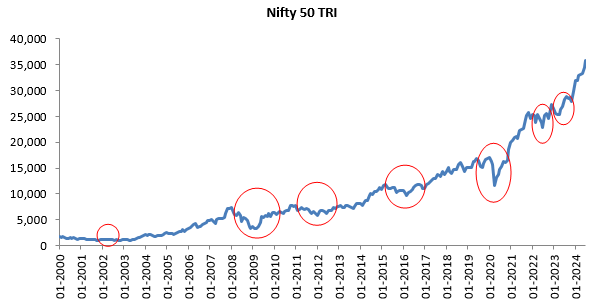
Source: National Stock Exchange, as on 30th June 2024. Disclaimer: Past performance may or may not be sustained in the future
You can take advantage of market cycles by buying when valuations are cheap and selling when valuations are expensive. This is the age old investment wisdom of “Buy low and sell high”. However, investors do exactly the opposite. This is due behavioural biases which investors have. The behavioural bias of greed and fear causes investors to buy high and sell low. In bull markets, investors think that the market will rise further and they keep buying even though prices are high. In bear markets, investors think that the market will fall further, so they sell in panic even though they should be buying because prices are low.
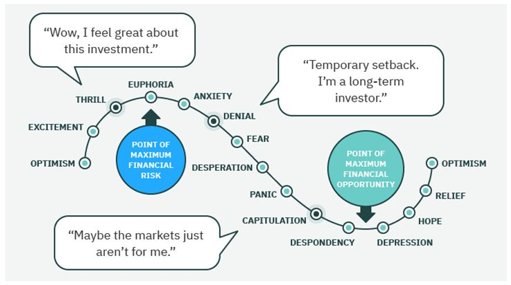
Why behavioural factor cannot be ignored?
Though extensive work has been done in the area of behavioural finance, both investors and their financial advisors tend to underestimate the impact of behavioural biases on investment returns. A study by Dilbar Inc in the United States show that actual investor returns were lower by 40% then the asset class returns. A major reason for lower investor return was voluntary behaviour, which was a result of the emotional or behavioural biases which investors have.
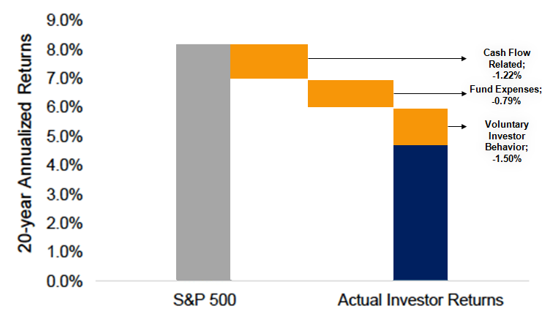
Source: Dalbar Inc. Period: 2004-2024. Disclaimer: The data/statistics are given to explain general market trends and it should not be construed as any research report/research recommendation
Behavioural biases have been seen in our market too. Domestic MF flows have been influenced by market exuberance or fear / pessimism, in contrast to market fundamentals
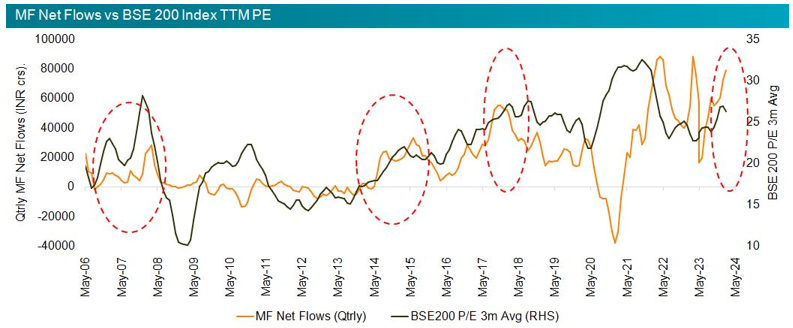
Source: Canara Robeco MF. Period: 2006-2024. Disclaimer: The data/statistics are given to explain general market trends and it should not be construed as any research report/research recommendation
Importance of asset allocation
Winners rotate across asset classes. There is low correlation of returns between debt and equity (see the chart below).
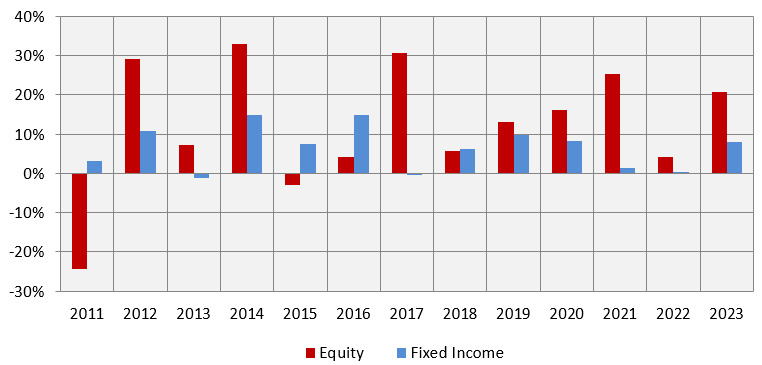
Source: National Stock Exchange, Advisorkhoj Research. Period: 1st January 2011 to 31st December 2023. Equity is represented by Nifty 50 TRI and debt by Nifty 10 year benchmark G-Sec index. Disclaimer: Past performance may or may not be sustained in the future
Why Balanced Advantage Funds?
Balanced advantage funds solve the behavioural bias problem by taking emotions out of investing using a model based approach. Balanced advantage funds manage their asset allocation between debt and equity using a dynamic asset allocation model. The chart below shows the annual returns of equity, debt and balanced advantage funds category average. You can see that balanced advantage funds can capture market upside, reduce downside risk and bring stability to your portfolio.
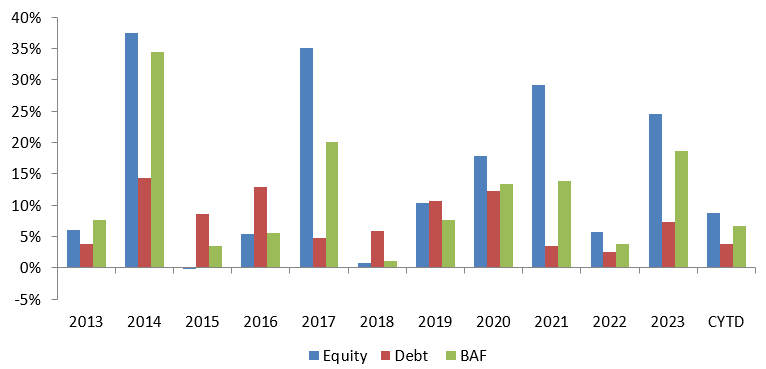
Source: National Stock Exchange, Advisorkhoj Research. Period: 1st January 2013 to 31st May 2024. Equity is represented by BSE 200 TRI and debt by Crisil Composite Bond Fund Index. Disclaimer: Past performance may or may not be sustained in the future
How will the Canara Robeco BAF model work?
The fund uses a 3 factor asset allocation model. It will change the asset allocation accordingly and rebalance the portfolio from time to time.
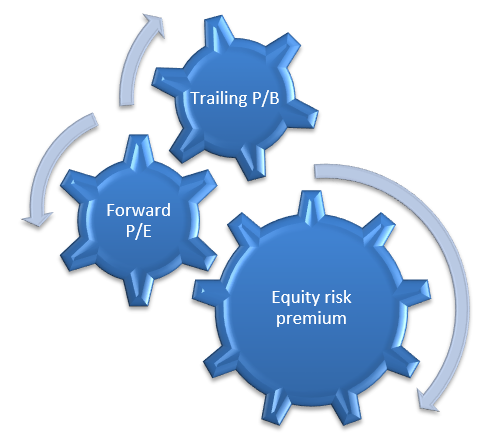
The model effectively suggests changes in equity allocation depending on changes in fundamental factors. Same has been tested across timeframes.
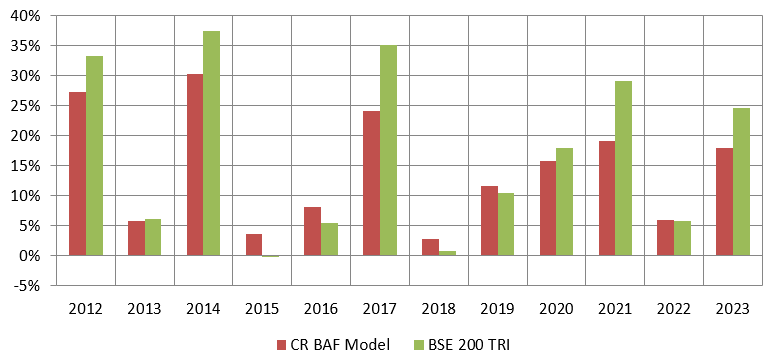
Back Testing Results
The model was able to outperform the benchmark index over different time periods.
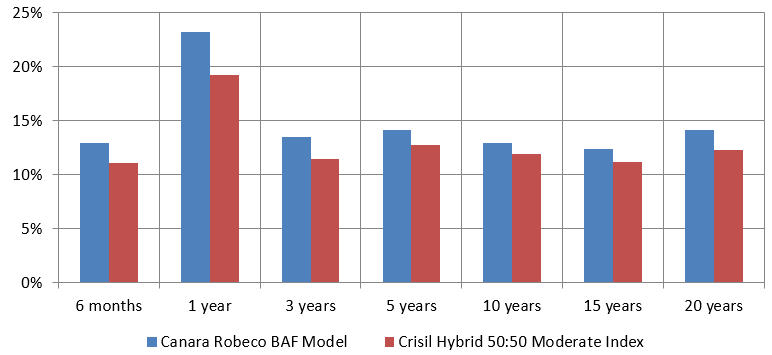
Source: Canara Robeco, as on 28th March 2024. Disclaimer: The results are purely illustrative and do not indicate how the fund will perform in different market conditions or point to point periods in the future.
The model was able to capture 70 to 90% equity upside in most years and was also able to outperform equities in volatile markets.
Why invest in Canara Robeco Balanced Advantage Fund?
- Take emotions out of investing and avoid pitfalls caused by behavioural biases
- Navigate through market volatility – less volatility, more peace of mind
- Adapt to changing market conditions
- Relatively stable returns compared to equity funds
- Potential risk adjusted returns
- Tax efficiency
Who should invest in Canara Robeco Balanced Advantage Fund?
- Investors who want capital appreciation and income over long investment tenures
- Investors who do not want high volatility in their portfolios
- Investors with minimum 3 to 5 years investment horizon
- New investors or investors who do not have experience of volatile markets can invest in this scheme
- You should consult with your financial advisor or mutual fund distributor if Canara Robeco Balanced Advantage Fund is suitable for your investment needs.
Mutual Fund Investments are subject to market risk, read all scheme related documents carefully.
Queries
-
What is the benefit of mutual fund STP
Aug 29, 2019
-
How much to invest to meet target amount of Rs 2 Crores
Aug 26, 2019
-
Can I achieve my financial goals with my current mutual fund investments
Aug 24, 2019
-
Can you tell me return of various indices
Aug 19, 2019
-
What would be the post tax return on different investments
Aug 18, 2019
-
Which Principal Mutual Fund scheme will be suitable for my retirement corpus
Aug 16, 2019
-
What is the minimum holding period for availing NCD interest
Aug 4, 2019
Top Performing Mutual Funds
Recommended Reading
Fund News
-
Groww Mutual Fund launches Groww Nifty Smallcap 250 ETF
Oct 13, 2025 by Advisorkhoj Team
-
Motilal Oswal Mutual Fund launches Motilal Oswal Consumption Fund
Oct 6, 2025 by Advisorkhoj Team
-
Kotak Mahindra Mutual Fund launches Kotak Gold Silver Passive FOF
Oct 6, 2025 by Advisorkhoj Team
-
Invesco Mutual Fund launches Invesco India Consumption Fund
Oct 6, 2025 by Advisorkhoj Team
-
ICICI Prudential Mutual Fund launches ICICI Prudential Conglomerate Fund
Oct 6, 2025 by Advisorkhoj Team


