Investing in Balanced Funds versus a portfolio of Equity and Debt funds

Balanced Mutual funds are excellent investment options for investors with moderate risk tolerance, since they can generate excellent returns for the investors with limited downside risks. In fact balanced funds have seen excellent inflows over the past couple of years. These funds are essentially hybrid funds, with 65 - 70% of the portfolio invested in equities and the rest in fixed income securities. One question we come across in financial blogs and in discussions with investors is whether an investor can generate similar or superior returns than balanced funds by investing in a portfolio of equity and debt funds. It is an interesting question, which we will examine with the help of an example in this blog. While the analysis in this blog is by no means the final word on this debate, hopefully it will provide investors and financial advisors some useful guidance.
The Tax Benefit Angle
At the very outset we should discuss the taxation issues. Balanced funds, from a tax perspective are treated like equity funds, because these funds have at least 65% of their portfolio invested in equities. Like equity funds, capital gains from investment in balanced funds held for over 12 months is tax free. Capital gains from investment in debt funds held for a period of less than 36 months is added to the income of the investor and taxed as per the investor’s tax rate. Capital gains from investment in debt funds held for over 36 months is taxed at 20% with indexation benefits. Therefore, purely from a capital gains tax standpoint, investment in balanced fund is more efficient than investment in a combination of equity and debt fund.
Can Investment in portfolio of equity and debt funds generate superior returns than a balanced fund?
Let us examine this with the help of an example. For our analysis we have chosen three funds, a balanced fund, a diversified equity fund and an income fund. Let us assume we have an investment amount of र 100,000. We will compare the returns of a र 100,000 investment in a balanced fund with the returns of a र 100,000 investment in a portfolio of a diversified equity and income fund, over a horizon of 10 years. For our analysis, we have chosen HDFC Prudence Fund as our balanced fund. For our portfolio of diversified equity and income fund, we have chosen HDFC Equity Fund and HDFC High Interest Fund – Dynamic Plan. Is there any rationale behind the selection of these three funds?
- The fund house has been chosen at random
- All three funds are among the most popular funds in their respective categories
- All three funds are seasoned and have excellent long term track record
- HDFC Equity Fund and HDFC Prudence Fund have been managed for a long period of time by the same fund manager, one of the most well known fund managers in the industry. Therefore, between the two funds’ performance, there should be no performance bias attributable to fund manager.
- The modified duration of debt portion of HDFC Prudence Fund is 7.5, while the modified duration of HDFC High Interest Fund – Dynamic Plan is 8. Therefore, the interest rate risk profile for the debt portion of HDFC Prudence Fund and HDFC High Interest Fund – Dynamic Plan is similar.
Let us assume we invested र 100,000 in HDFC Prudence Fund at the end of 2004. At the same time we invested र 100,000 in a portfolio of HDFC Equity Fund and HDFC High Interest Fund – Dynamic Plan. HDFC Prudence Fund has an asset allocation of 75% Equity and 25% Debt. Therefore, for like to like comparison, let us assume for our portfolio of equity and debt fund, we invested र 75,000 in HDFC Equity Fund and र 25,000 in HDFC High Interest Fund – Dynamic Plan. Let us see the returns generated by the portfolio of HDFC Equity Fund and HDFC Interest Fund versus HDFC Prudence Fund over the 2005 to 2014 period.
Comparison of Returns
Let us assume we are passive investors, in other words, we do not make any changes to our portfolio.
The chart below shows the annual returns of the HDFC Equity fund from 2005 to 2014.
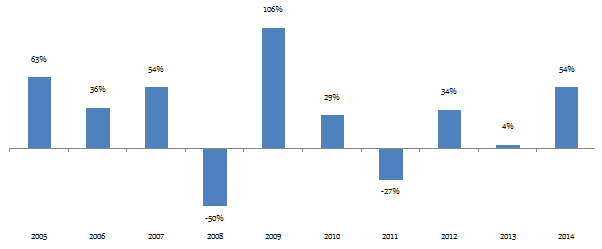
Except 2008, 2011 and 2013, HDFC Equity gave in excess of 25% returns every year. Let us now see annual returns of HDFC High Interest Fund – Dynamic Plan in the 2005 to 2014 period.
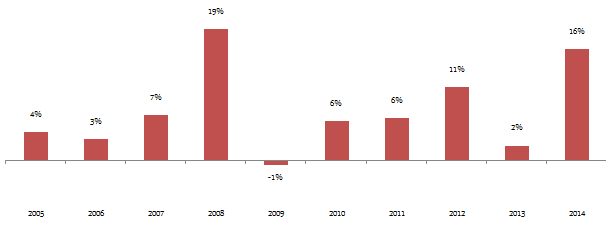
The returns of the fund were expectedly modest in the years when bond yields were in an upward trend and high in the years when bond yields declined, but the returns were almost never negative. Let us now see annual returns of HDFC Prudence Fund in the 2005 to 2014 period.
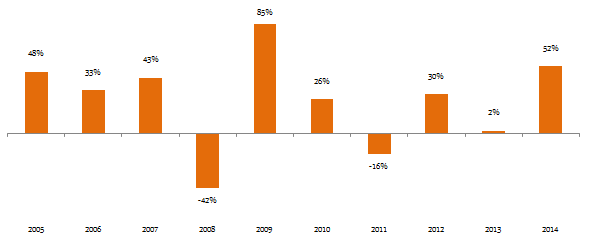
As one would expect the returns of HDFC Prudence Fund was lower than HDFC Equity Fund in bull market years and higher in the bear market years.
Let us now see how much returns, the portfolio of HDFC Equity Fund and HDFC High Interest Fund – Dynamic Plan, generated over the investment horizon. The chart below shows the growth of र 100,000 in the portfolio over the investment horizon (values shown in the chart are that of end of the period).
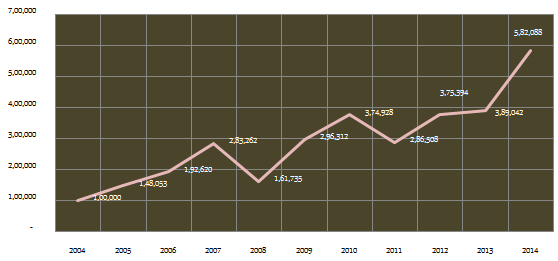
र 100,000 investment in the portfolio at the end of 2004 would have grown to over र 582,000 by the end of 2014, nearly 6 times in 10 years. Let us now compare this with the growth of र 100,000 in HDFC Prudence Fund over the investment horizon (values shown in the chart are that of end of the period).
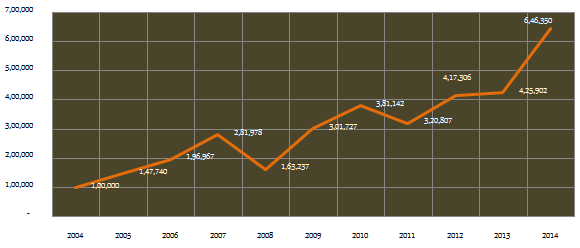
र 100,000 investment in HDFC Prudence Fund at the end of 2004 would have grown to over र 646,000 by the end of 2014. The return of HDFC Prudence Fund is higher by 11% than that of the portfolio of HDFC Equity Fund and HDFC High Interest Fund – Dynamic Plan. Not only that, if we were to redeem our investment at any point of time between 2005 to 2014, for most of the time, as we can see from the charts above, we would get a higher return from the HDFC Prudence Fund compared to the portfolio of HDFC Equity Fund and HDFC High Interest Fund – Dynamic Plan.
Dynamic Rebalancing instead of passive investing
Balanced Funds rebalances their investment portfolio based on their target asset allocation (between equity and debt). That may partly explain the outperformance of HDFC Prudence Fund against the portfolio of HDFC Equity Fund and HDFC High Interest Fund – Dynamic Plan, where we adopted a passive investing approach. What if we rebalanced our portfolio of HDFC Equity Fund and HDFC High Interest Fund – Dynamic Plan at the end of the every year to bring it back to the target allocation of 75% equity and 25% debt?
Let us assume, we review our portfolio of HDFC Equity Fund and HDFC High Interest Fund – Dynamic Plan at the end of every year over the investment horizon. Whenever the value of units of HDFC Equity Fund exceeded 75% of the total portfolio value, we redeemed some units of the fund and re-invested in HDFC High Interest Fund – Dynamic Plan, to bring back our asset allocation to 75% Equity and 25% Debt. Also, whenever the value of units of HDFC Equity Fund fell below 75% of the total portfolio value, we redeemed some units of the HDFC High Interest Fund – Dynamic Plan and re-invested in HDFC Equity Fund, to bring back our asset allocation to 75% equity and 25% debt. The idea is to ensure that at the beginning of every year, we had 75% equity and 25% debt allocation in our portfolio. The chart below shows the changes made to the portfolio every year to bring the asset allocation back to 75% equity and 25% debt.

The chart above shows that we redeemed र 10,986 from HDFC Equity fund and reinvested the same amount in HDFC High Interest Fund – Dynamic Plan at the end of 2005. At the end of 2006, we redeemed र 9,091 from HDFC Equity fund and reinvested the same amount in HDFC High Interest Fund – Dynamic Plan. In 2007, we redeemed र 16,668 from HDFC Equity fund and reinvested the same amount in HDFC High Interest Fund – Dynamic Plan. In 2008, we redeemed र 34,639 from HDFC High Interest Fund – Dynamic Plan and reinvested the same amount in HDFC Equity Fund, so on so forth. Apart from ensuring consistency in asset allocation, this strategy makes sense because we are shifting from equity to debt when equity valuations are getting richer and moving from debt to equity when equity valuations are lower. Let us see if our portfolio returns are higher with the dynamic rebalancing strategy. The chart below shows the growth of र 100,000 in the portfolio over the investment horizon with a dynamic rebalancing strategy.
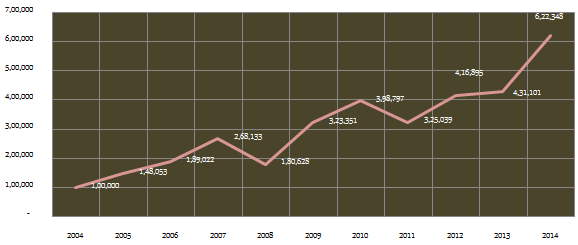
As expected the returns of the portfolio with dynamic rebalancing strategy is much better than the passive portfolio, from 2009 onwards. Whereas the value of the passive portfolio of HDFC Equity Fund and HDFC High Interest Fund – Dynamic Plan at the end of 2014 was little over र 582,000, the value of dynamically rebalanced portfolio at the end of 2014 was over र 622,000. The returns of the dynamically rebalanced portfolio are closer to the returns of the balanced fund.
The Taxation Problem
In 2014 the capital gains taxation of debt funds was changed. The minimum holding period for long term capital gains for debt funds is now 36 months. Before 2014, the minimum holding period for long term capital gains for debt funds was 12 months. Therefore, the results of the analysis in our example still hold. But going forward, under the current tax laws, redeeming debt funds before 36 months to rebalance your portfolio is a disincentive, because you can lose up to 30% of the gains in taxes. If we were to apply the current debt fund tax laws retrospectively in our analysis, we will not be able to redeem from the debt fund and reinvest in equity before 36 months pass till the debt fund units to be redeemed had been purchased. Having said that the results of our analysis, even if the new debt fund taxation were to apply retrospectively, would not change. But investors must understand that this is purely a coincidence. If equity markets are very volatile, then dynamic rebalancing every year can attract short term capital gains tax for debt fund investments.
Conclusion
In this blog we have examined if investor can generate similar or superior returns than balanced funds by investing in a portfolio of equity and debt funds. While the findings of this blog is by no means the final word on this subject, in my opinion, a fund manager has far broader spectrum of choices in terms of securities (both equity and fixed income) to invest compared to a mutual fund investor in terms of choice of funds to invest, in order to generate the most optimal returns. The fund manager also has some flexibility with regards to asset allocation to take advantage of market opportunities, while staying within the broader investment mandate. Therefore the average retail investor looking to invest in balanced funds should choose a good fund in consultation with their financial advisor and simply rely on the fund manager to generate good returns. On the other hand, if you are an expert and experienced investor with unique investment needs, you can try to create your own hybrid mutual fund portfolio with equity and debt funds. However, make sure that you have a robust, tax efficient rebalancing strategy in order to get the best returns. I, for one, would simply select a good balanced fund and stick to it, but we do welcome your opinion on this subject.
Queries
-
What is the benefit of mutual fund STP
Aug 29, 2019
-
How much to invest to meet target amount of Rs 2 Crores
Aug 26, 2019
-
Can I achieve my financial goals with my current mutual fund investments
Aug 24, 2019
-
Can you tell me return of various indices
Aug 19, 2019
-
What would be the post tax return on different investments
Aug 18, 2019
-
Which Principal Mutual Fund scheme will be suitable for my retirement corpus
Aug 16, 2019
-
What is the minimum holding period for availing NCD interest
Aug 4, 2019
Top Performing Mutual Funds
Recommended Reading
Fund News
-
Axis Mutual Fund joins ONDC Network to Expand Access to Mutual Fund Investments
Apr 18, 2025 by Axis Mutual Fund
-
Nippon India Mutual Fund launches Nippon India Nifty 500 Quality 50 Index Fund
Apr 18, 2025 by Advisorkhoj Team
-
Nippon India Mutual Fund launches Nippon India Nifty 500 Low Volatility 50 Index Fund
Apr 18, 2025 by Advisorkhoj Team
-
RBI Monetary Policy: RBI changes policy stance and lowers rate
Apr 9, 2025 by Axis Mutual Fund
-
Kotak Mahindra Mutual Fund launches Kotak Nifty Top 10 Equal Weight Index Fund
Apr 7, 2025 by Advisorkhoj Team


