Why invest in Nippon India Asset Allocator FOF now

Nippon India Asset Allocator Fund of Funds is a fund of funds (FOF) which invests in mutual funds and exchange traded funds of different asset classes. It aims to provide exposure to multiple asset classes e.g. equity, debt, gold etc. The asset allocation framework of the scheme is based on selecttime-tested and robust set of Macro and Market Variables. The scheme was launched in February 2021 and has given 11.7% CAGR returns till date (as on 6th July 2022). Check the complete scheme details here.
Current market context
Global financial markets have been going through turmoil over the past few months due to high inflation and concerns that it may lead to global recession. The US Federal Reserve has tightening monetary policy and this is causing risk aversion in global equity markets. The Russia – Ukraine war and economic sanctions of Russian exports has further complicated the situation. The Nifty 50 TRI is down by around 9% on an YTD basis (as on 6th July 2022). Rising bond yields is causing volatility in debt markets. While rising yields cause volatility in longer duration debt products, short term yields are now attractive. In uncertain economic environments, having exposure to multiple asset classes reduces portfolio drawdown and provides much needed stability to your investment portfolio.
Nippon India Asset Allocator Fund of Funds which invests in multiple asset classes can add stability to your portfolio, while balancing risk / return from a long term perspective to you.
Why you need exposure to multiple asset classes?
Different asset classes e.g. equity, fixed income, gold etc have different investment cycles. There is low or even negative correlation in returns of two or more asset classes. The chart below shows annual returns of equity (represented by Nifty 50 TRI), debt (represented by Nifty 10 year benchmark G-Sec index) and Gold. You can see in that equity and gold are usually counter-cyclical and there is low correlation between debt and the other two asset classes.

Source: National Stock Exchange, Advisorkhoj Research. Equity: Nifty 50 TRI; Debt: Nifty 10 year Benchmark G-Sec Index; Gold: INR price of Gold. Returns calculated as on 30th June 2022. Disclaimer: Past performance may or may not be sustained in the future. The chart above is purely for investor education purposes and should not construed as investment recommendation.
Winners keep rotating even within an asset class
Even within a particular asset class, winners keep rotating among different asset sub classes. For example, within equity asset class, in the last 11 years, large caps were the top performers in 5 years, midcaps in 1 year and small caps in 5 years.
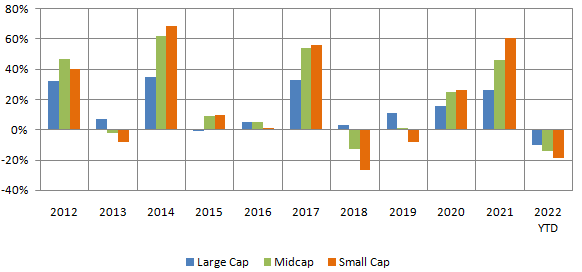
Source: National Stock Exchange, Advisorkhoj Research. Large Cap: Nifty 100 TRI; Midcap: Nifty Midcap 150 TRI; Small Cap: Nifty Small Cap 150 TRI. Returns calculated as on 30th June 2022. Disclaimer: Past performance may or may not be sustained in the future. The chart above is purely for investor education purposes and should not construed as investment recommendation.
Within the fixed income (debt) asset class, in the last 10 years, shorter duration funds outperformed in 5 years, while longerduration funds outperformed in 5 years.
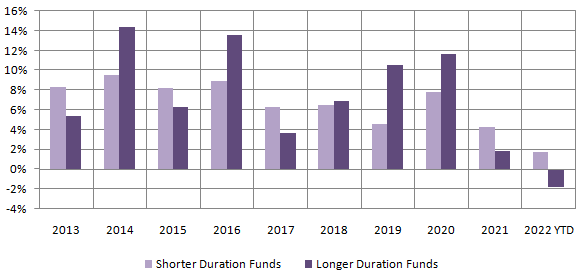
Source: Advisorkhoj Research. Shorter Duration Funds: Low duration and short duration funds category average; Longer Duration Funds: Medium to long duration, long duration and Gilt funds with 10 years constant durations category average. Returns calculated as on 30th June 2022. Disclaimer: Past performance may or may not be sustained in the future. The chart above is purely for investor education purposes and should not construed as investment recommendation.
Current portfolio of Nippon India Asset Allocator Fund of Funds
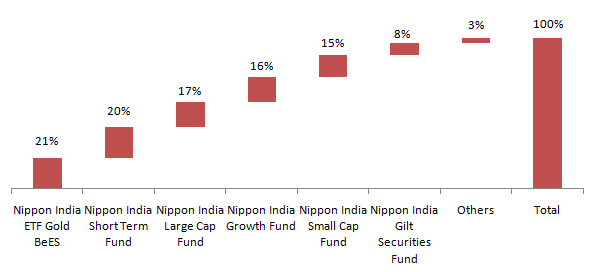
Source: Nippon India Mutual Fund Factsheet May 2022.
Why invest in Nippon India Asset Allocator Fund of Funds in current market situation?
- Predicting trends (peaks and troughs) of different asset classes is very difficult. Fundamental drivers of different asset classes are different. The extent to which equity valuations or bond yields can guide asset allocation is limited.
- Nippon India Asset Allocator Fund of Funds is a step ahead of equity funds in that it provides exposure to multiple asset classes. Having exposure to multiple asset classes will provide stability in uncertain markets.
- The FOF has higher allocation to short duration debt to capture steepening yields at the shorter end of the yield curve and at the same time reduce interest rate risk for the portfolio.
- While rising US Treasury Bond yields are limiting potential upside from Gold in an inflationary environment, Gold as an asset class can outperform if the US economy slides into recession once monetary tightening (rate hike) cycle is over.
- Tactical asset allocation of the FOF can benefit from investment cycles of different asset classes / sub-classes. The FOF has been increasing mid and small cap allocations over the past couple of months taking advantage of the sharp corrections in those segments.
How Nippon India Asset Allocator Fund of Funds works?
The asset allocation strategy of the scheme is based on the following premises:-
- Follow global clues.
- Financial markets are inter-connected. Liquidity flows from one asset class to another.
- Assess Fundamental, Macro, Behavioural & Sentiment Factors of all Asset Classes before going forAsset Allocation.
- Rule based investing

How has the asset allocation model worked across different market conditions?
The asset allocation model of Nippon India Asset Allocator Fund of Funds has been back-tested across different market conditions. The asset allocation is intuitive, driven by sound economic logic and also takes liquidity, momentum etc. into consideration.
The chart below shows the asset allocation of the fund since inception till May 2022.
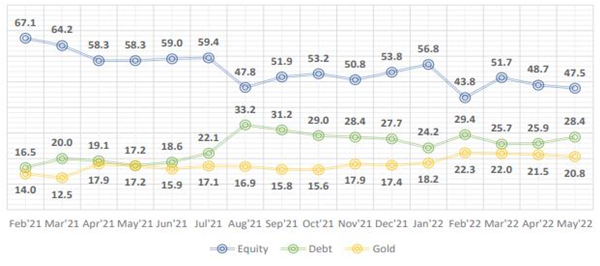
Source: Nippon India Mutual Fund, as on 31st May 2022. Disclaimer: Past performance may or may not be sustained in the future. The chart above is purely for investor education purposes and should not construed as investment recommendation.
The chart below shows the allocation within equities (e.g. large, mid and small caps) since inception. You can see that the FOF aims to capture upside potential and is quick to shed risks as valuations get expensive.
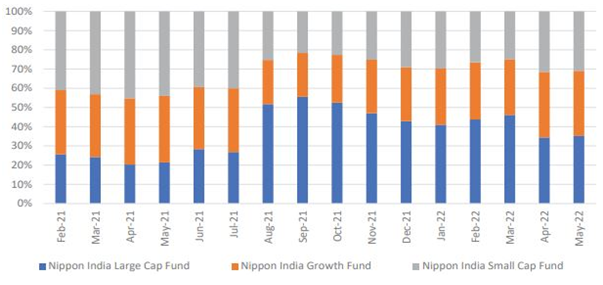
Source: Nippon India Mutual Fund, as on 31st May 2022. Disclaimer: Past performance may or may not be sustained in the future. The chart above is purely for investor education purposes and should not construed as investment recommendation.
Performance of Nippon India Asset Allocator Fund of Funds
The chart below shows the growth of Rs 10,000 investment in Nippon India Asset Allocator Fund of Funds versus Gold since the scheme’s inception.

Source: Advisorkhoj Research, as on 5th July 2022. Disclaimer: Past performance may or may not be sustained in the future.
Who should invest in Nippon India Asset Allocator Fund of Funds?
- Investors who want capital appreciation over sufficiently long investment horizons with limited downside in volatile markets.
- Investors who want exposure to multiple asset classes.
- Investors with moderately high to high risk appetites.
- Investors with tenures of at least 3 – 5 years.
Investors should consult with their financial advisors if Nippon India Asset Allocator Fund of Funds is suitable for their investment needs.
Mutual Fund Investments are subject to market risk, read all scheme related documents carefully.
Queries
-
What is the benefit of mutual fund STP
Aug 29, 2019
-
How much to invest to meet target amount of Rs 2 Crores
Aug 26, 2019
-
Can I achieve my financial goals with my current mutual fund investments
Aug 24, 2019
-
Can you tell me return of various indices
Aug 19, 2019
-
What would be the post tax return on different investments
Aug 18, 2019
-
Which Principal Mutual Fund scheme will be suitable for my retirement corpus
Aug 16, 2019
-
What is the minimum holding period for availing NCD interest
Aug 4, 2019
Top Performing Mutual Funds
Recommended Reading
Fund News
-
Groww Mutual Fund launches Groww Nifty PSE ETF
Jan 22, 2026 by Advisorkhoj Team
-
Samco Mutual Fund launches Samco Mid Cap Fund
Jan 22, 2026 by Advisorkhoj Team
-
WhiteOak Capital Mutual Fund launches WhiteOak Capital Consumption Opportunities Fund
Jan 20, 2026 by Advisorkhoj Team
-
Shriram Mutual Fund launches Shriram Money Market Fund
Jan 19, 2026 by Advisorkhoj Team
-
PPFAS Mutual Fund launches Parag Parikh Large Cap Fund
Jan 19, 2026 by Advisorkhoj Team


