Where are the mutual funds deploying your funds?

The mutual funds are allocating a higher portion of their assets under management (AUM) to stocks in banking and finance sectors. As per the data published by the Securities and Exchange Board of India (SEBI) 27% of assets under management (AUM) of all mutual funds in May, had been deployed to the banking and finance sector, up 2% from the allocation to this sector in the April. Banking and finance sector, incidentally has the highest allocation of mutual funds AUM among all other sectors. Along with banking and finance, allocations to other cyclical sectors like Oil and Gas, Auto and Auto Ancillaries, Construction, Cement, Capital Goods etc are trending higher in the past few months. At the same time, allocations to defensive sectors like Information Technology (IT) and Pharmaceuticals and Healthcare is trending lower. Allocation to IT is lower 2% month on month in May, compared to April. This trend is a clear sign of bullishness in the market, and an indicator of future outperformance by the cyclical sectors.
Top 10 sector allocations by all mutual funds in May
The average AUM of all mutual funds in India in the month of May was Rs 224,000 crores, up almost Rs 20,000 crores from the month of April. About Rs 60,000 crores was invested in stocks in the banking and finance, around Rs 23,000 crores invested in IT and around Rs 19,000 crores invested in the Oil and Gas sector. The table below shows the top 10 sectors, in terms of percentage allocation of AUM of all mutual funds in May.
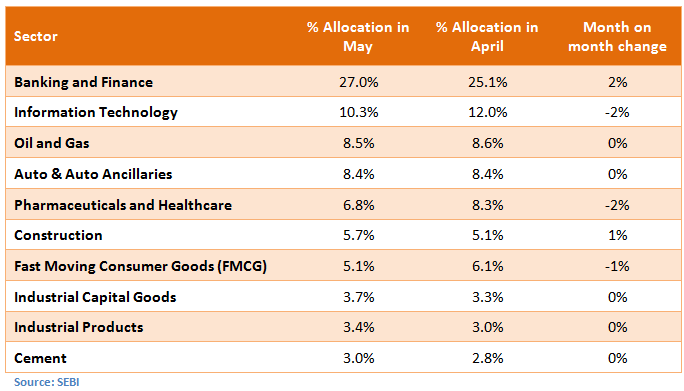
We can see from the table above that, while allocations to sectors like Banking and Construction is higher in May, the allocations to defensives like IT, Pharmaceuticals and FMCG is lower, confirming the bias towards cyclical sectors, as discussed several times in our blog, over the past few months.
The trend has been similar over the past few months
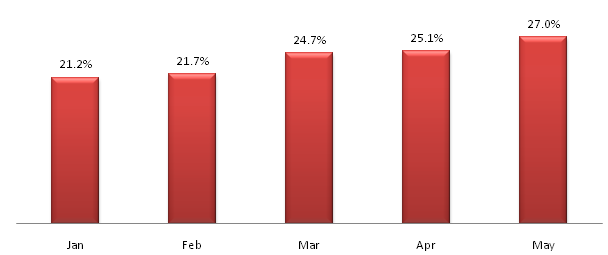
The bias towards cyclical sectors has been observed ever since the beginning of 2014. The allocation to banking and finance has risen by 6% points from January to May (27% in May versus 21% in January). Similarly, the percentage allocation to construction has increased by 2% points from January to May, while the percentage allocation to capital goods has increased by 1% points from the January to May. At the same time the percentage allocation to defensive sectors, like IT, Pharmaceuticals and FMCG has been trending lower, over the same time period.
The chart below shows, the percentage of assets under management deployed in the Banking and Finance sector from January to May 2014. Increased allocation to Banking and Finance is an indicator of bullishness in equity markets.
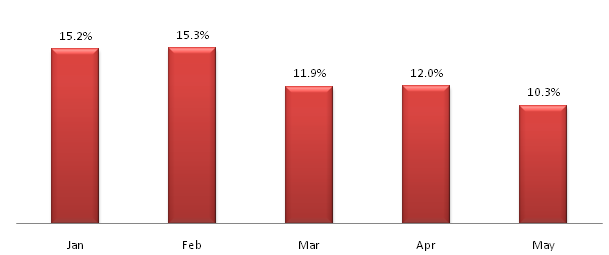
The chart below shows, the percentage of assets under management deployed in the Information Technology sector from January to May 2014. Reduction in percentage allocation to a defensive sector like IT again is an indicator of bullishness in the market as well as the currency (INR).
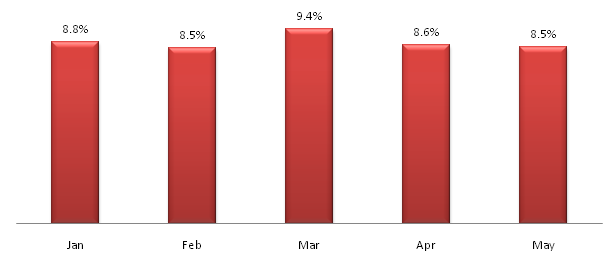
The chart below shows, the percentage of assets under management deployed in the Oil and Gas sector from January to May 2014. The performance of the Oil and Gas sector is heavily dependent on governmental policies, e.g. gas pricing, subsidies etc. Once there is clarity of the government’s policies, a clear trend is likely to emerge.
The chart below shows, the percentage of assets under management deployed in the Auto and Auto Ancillaries sector from January to May 2014. This trend again, confirms the bullishness in the market.
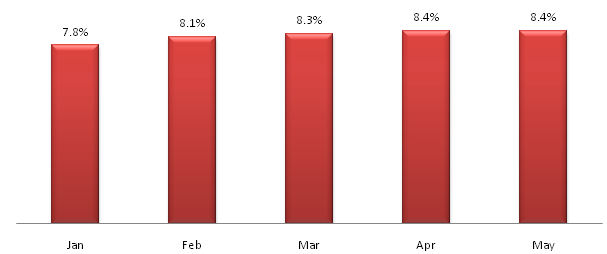
The chart below shows, the percentage of assets under management deployed in the Pharmaceuticals and Healthcare sector from January to May 2014.
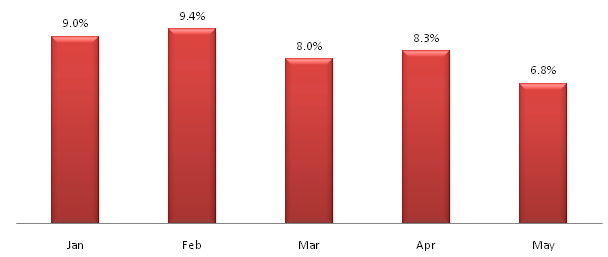
How can you use this information?
- If you invest directly in equities or shares, using this information, you know what the professional fund managers are doing. This information gives you reference point for your own equity investment strategy. However, it is important to note that, mutual fund managers have a long term investment horizon. Therefore, if you want to replicate mutual fund managers’ strategies for your own equity portfolio, you should ensure that you also have a sufficiently long term investment horizon.
- If you invest in mutual funds, as an informed investor, you should be aware about your fund manager’s sector allocation strategy, relative to other fund managers in the industry. In this article, we have discussed how all mutual funds have been deploying there assets under management over the past few months. The stock and sector allocation of your mutual fund is reported in the monthly factsheets. You can compare the sector allocation of your mutual fund and the month on month change, with the sector allocation of all mutual funds. Your fund’s sector allocation percentages are likely to be different, than the sector allocation percentages discussed in this article. After all, your fund manager will not be able to generate an alpha (or outperformance) for your fund, by following what everyone else is doing. However, is your fund manager doing something that is against the trend of the market, e.g. increasing allocations to defensive sectors, when others are reducing? That is something you may want to watch out for.
- If you are an active equity investor, you should always be on look out for good investment opportunities, whether directly in shares or in mutual funds. For that, you need to be aware of what is going on in the market, rather than investing blindly, based on tips or advice. Smart equity investors take into account what institutional investors, whether foreign (FII) or domestic (DII), are doing. Mutual funds and insurance companies are domestic institutional investors (DIIs), and they account for a large portion of the equity market volumes.
Conclusion
In this article, we have discussed how mutual funds have been deploying their assets under management over the past few months. This information is published by SEBI every month. We will discuss it in our blog from time to time. As an informed investor, you should ensure that you are aware of the latest trend in equity markets.
Queries
-
What is the benefit of mutual fund STP
Aug 29, 2019
-
How much to invest to meet target amount of Rs 2 Crores
Aug 26, 2019
-
Can I achieve my financial goals with my current mutual fund investments
Aug 24, 2019
-
Can you tell me return of various indices
Aug 19, 2019
-
What would be the post tax return on different investments
Aug 18, 2019
-
Which Principal Mutual Fund scheme will be suitable for my retirement corpus
Aug 16, 2019
-
What is the minimum holding period for availing NCD interest
Aug 4, 2019
Top Performing Mutual Funds
Recommended Reading
Fund News
-
Axis Mutual Fund launches Axis Gold and Silver Passive FOF
Dec 10, 2025 by Advisorkhoj Team
-
Jio BlackRock Mutual Fund launches JioBlackRock Arbitrage Fund
Dec 9, 2025 by Advisorkhoj Team
-
Tata Mutual Fund launches Tata BSE Multicap Consumption 50:30:20 Index Fund
Dec 9, 2025 by Advisorkhoj Team
-
Edelweiss Mutual Fund launches Edelweiss Silver ETF Fund of Fund
Dec 8, 2025 by Advisorkhoj Team
-
Abakkus Mutual Fund launches Abakkus Liquid Fund
Dec 8, 2025 by Advisorkhoj Team


