SBI Magnum Equity Fund: Strong performance in the last 3 years

In the last 3 years, SBI Magnum Equity Fund has given around 18% annualized returns versus 12% annualized Nifty returns. This large cap fund underperformed slightly in 2013 but bounced back strongly in 2014 and has been in the top 2 performance quartiles in 2014, 2015 and 2016. 2015 was a bad year for large cap funds. After a superlative 2014, in which SBI Magnum Equity Fund gave around 43% return, 2015 was a bad year for the large cap market segment; SBI Magnum Equity Fund was one of the few large cap funds which gave positive (albeit small) return in 2015. Again in 2016, SBI Magnum Equity Fund was able to beat both Nifty and the large cap fund category average. The chart below shows the annual returns of SBI Magnum Equity Fund over the last 5 years.
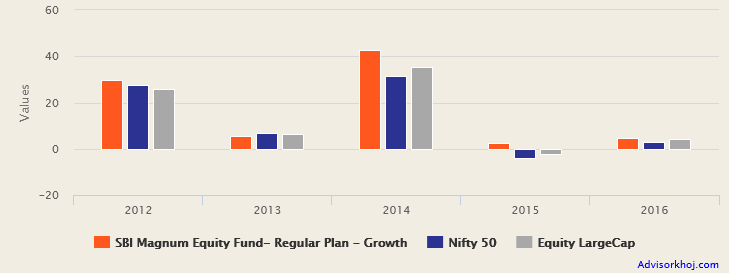
Source: Advisorkhoj Research
SBI Magnum Equity Fund was launched in November 2006 and has around Rs 1,790 Crores of Assets under Management. The expense ratio of the fund is 2.12%. R. Srinivasan is the fund manager of this mutual fund scheme. The chart below shows the NAV growth of SBI Magnum Equity Fund since inception.
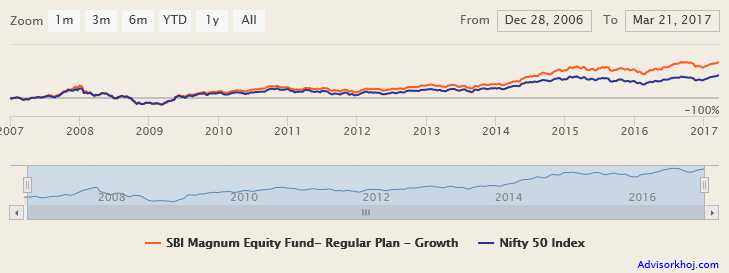
Source: Advisorkhoj Research
One interesting statistic of SBI Magnum Equity Fund which distinguishes this fund from many of its large cap peers is the relatively low turnover ratio. Turnover ratio is a measure of portfolio churn; 100% turnover ratio means that, the entire portfolio has been churned in the last one year. The turnover ratio of SBI Magnum Equity Fund is 46%, whereas the turnover ratios of many peers are almost double or triple of this. When fund manager churns their portfolio (buy or sell securities) they incur transaction costs like brokerage, Securities Transaction Tax etc. These costs increase the expense ratio of the scheme. Some mutual fund experts like low turnover ratios because it keeps the cost low.
In Advisorkhoj, we have a neutral view on turnover ratio. Our view is that, what matters to the investor is capital appreciation and wealth creation, irrespective of whether it is achieved through high or low portfolio turnover. However, portfolio turnover is a useful statistic for the investor because it tells you about the investment strategy of the fund manager. High portfolio turnover implies that the fund managers look to actively exploit market opportunities based on valuation differentials (book profits in richly valued stocks and buy cheaply valued ones). Low portfolio turnover is indicative of a long term buy and hold strategy.
Another theory regarding portfolio turnover is that, it is high when market is rising (since opportunity to churn is more) and low when market is falling (since opportunity to churn is less). Over the past one year, the market has more or less been rising (Nifty has risen 18% in 12 months) and the relatively low portfolio turnover of SBI Magnum Equity Fund over this period implies that, the fund manager has stick to his conviction. The investment strategy of the fund manager is further reinforced by the fact that he is holding a very small portion of the portfolio in cash. Over a long investment horizon, long term convictions of the fund manager can pay off very handsomely for investors. Therefore, investors should have a long investment horizon for SBI Magnum Equity Fund.
In terms of conviction, the fund manager is biased towards cyclical sectors like Banking and Finance (31% of portfolio value), Petroleum (13%), Auto (7%) etc. The balance exposure is in cyclical sectors. The fund manager also has substantial allocations to defensive sectors like IT (15%), FMCG (8%) and Pharmaceuticals (8%). From a company concentration perspective, the Top 5 stock holdings of SBI Magnum Equity Fund in Infosys, HDFC Bank, SBI, Reliance and HCL Tech account for 33% of the portfolio value and the Top 10 stock holdings account for 51% of the portfolio. It is therefore, fairly well diversified from a company concentration standpoint. As per Morningstar, the Forward P/E ratio of SBI Magnum Equity Fund is slightly higher than the benchmark and category average. However, as and when, earnings (EPS) growth picks up, the portfolio can generate excellent returns for the investor.
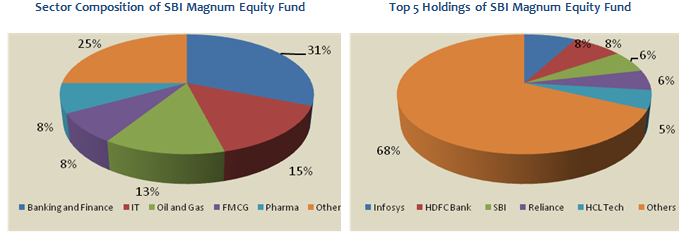
Source: Advisorkhoj Research
Retail investors like the fund managers of the schemes to beat the market, both in rising markets and falling markets. In Advisorkhoj, we like to see the performance of fund managers both in up and down markets on a segregated basis. We have developed a tool in our MF Research Section, Market Capture Ratio, which enables us to segregate performance in up and down markets. Up market and down market capture ratios shows us the outperformance of the fund manager in up and down market periods respectively.
HighUp Market Capture Ratio (more than 100%) is good, because it means the fund manager is able to generate higher than market returns when market is rising. LowDown Market Capture Ratio (less than 100%) is good, because it means the fund manager is able to provide some downside risk protection when market is falling. The Up Market Capture ratio of SBI Magnum Equity Fund is 108%, which means for every 1% rise in Nifty, the fund rose by 1.08%. The Down Market Capture ratio of SBI Magnum Equity Fund is 64%, which means for every 1% fall in Nifty, the fund fell by only 0.64%. Empirical evidence shows that, funds with high up market capture and low down market capture ratios can give superior long term returns.
Regular Advisorkhoj readers also know that, we think Rolling Return is one the best and truest measure of fund manager performance. The chart below shows the three year rolling returns of SBI Magnum Equity Fund versus the benchmark Nifty over the last 5 years. We chose a three year rolling returns period, because we believe that an investor must have a long investment horizon for equity funds (three years minimum for large cap funds).
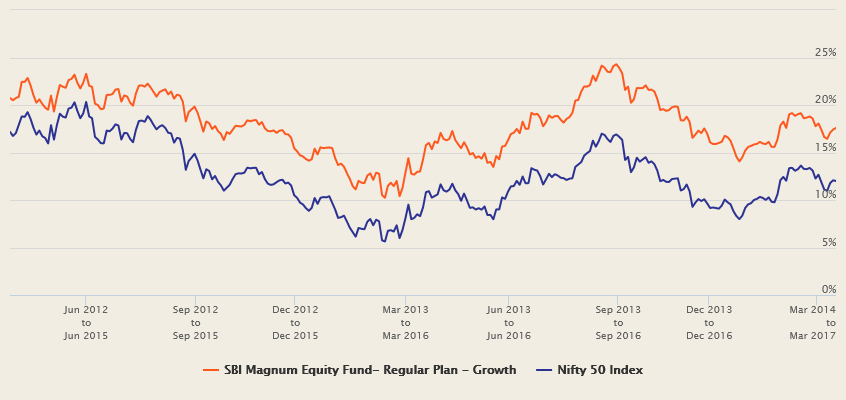
Source: Advisorkhoj Rolling Returns
As you can see, the fund manager has beaten the benchmark 100% of the times in terms of 3 year rolling returns over the last 5 years. Also, you can see that the outperformance versus Nifty is fairly stable, which shows that the fund manager has a prudent approach towards investments and risks. The rolling returns chart of SBI Magnum Equity Fundshows the consistent performance of the fund.
Conclusion
SBI Magnum Equity Fund has completed 10 years since inception. Investors should have a long investment horizon for this large cap fund. One can invest in this fund both through lump sum and SIP modes. Investors should consult with their financial advisors, if SBI Magnum Equity Fund is suitable for their mutual fund investment portfolios.
To Know more, Click here
Mutual Fund Investments are subject to market risk, read all scheme related documents carefully.
Queries
-
What is the benefit of mutual fund STP
Aug 29, 2019
-
How much to invest to meet target amount of Rs 2 Crores
Aug 26, 2019
-
Can I achieve my financial goals with my current mutual fund investments
Aug 24, 2019
-
Can you tell me return of various indices
Aug 19, 2019
-
What would be the post tax return on different investments
Aug 18, 2019
-
Which Principal Mutual Fund scheme will be suitable for my retirement corpus
Aug 16, 2019
-
What is the minimum holding period for availing NCD interest
Aug 4, 2019
Top Performing Mutual Funds
Recommended Reading
Fund News
-
Edelweiss Mutual Fund launches Edelweiss BSE Internet Economy Index Fund
Apr 25, 2025 by Advisorkhoj Team
-
Bajaj Finserv Mutual Fund launches Bajaj Finserv Nifty 50 Index Fund
Apr 25, 2025 by Advisorkhoj Team
-
SBI Mutual Fund launches SBI Income Plus Arbitrage Active FOF
Apr 23, 2025 by Advisorkhoj Team
-
Motilal Oswal Mutual Fund launches Motilal Oswal Infrastructure Fund
Apr 23, 2025 by Advisorkhoj Team
-
Groww Mutual Fund launches Groww Gilt Fund
Apr 23, 2025 by Advisorkhoj Team


