SBI Bluechip Fund: The best performing large cap fund in the last 3 years

If you had invested in SBI Blue-chip Fund 3 years back, you would have made a tax free profit of nearly 75% till date (Dec 3, 2016). While we should acknowledge that, 2014 was a bumper year for the Indian stock market, 2015 / early 2016 was one of the worst and this makes the performance of SBI Bluechip even more praiseworthy. This large cap fund was launched in February 2006 and has more than र 9,500 Crores of assets under management. The expense ratio of the fund is 1.98%. The chart below shows the NAV movement of SBI Bluechip Fund over the last 5 years.

Source: Advisorkhoj Research
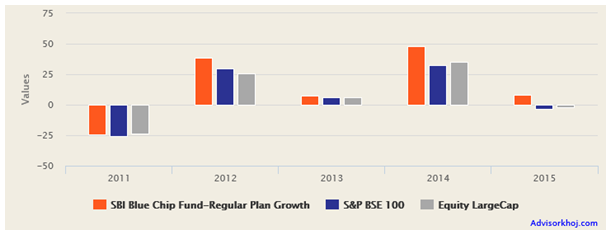
Sohini Andani is the fund manager of this scheme. In the last 5 years the fund has consistently outperformed the benchmark BSE – 100 and also the large cap funds category (in both bull and bear markets).

Source: Advisorkhoj Research
2012 and 2014 were bull market years, 2013 saw a flat market year, while 2011 and 2015 were bear market years. You can see in the above chart that the fund was able to beat the benchmark and the category returns across different market conditions in the last 5 years.
Market Capture Ratio metrics quantifies the outperformance of a fund in up markets and down markets separately. The up market capture ratio of SBI Bluechip Fund was 134%, which means that for every percentage point rise in BSE – 100 in up-market the fund NAV rose by 1.34%. The down market capture ratio of this fund was -790%, which implies that for every percentage point decline in BSE – 100 in falling market the fund NAV instead of falling, rose by 7.9%. It is, therefore, not surprising that the fund has always been in the top 2 quartiles from 2012 onwards (in fact, the fund has been in the top quartile for 3 consecutive years, 2014, 2015 and YTD 2016). Our proprietary Top Consistent Performers research tool shows that, SBI Bluechip Fund has been the among the most consistent large cap fund in the last 5 years.
Rolling Returns
The chart below shows the 3 year rolling returns of SBI Bluechip Fund since the inception of the fund. We chose a 3 year period for our analysis, because in our opinion investors should always have a long investment horizon (at least three years) for equity mutual funds. In fact many financial advisors recommend a 5 years or longer investment period for equity. While we have used 3 years rolling return for our analysis in this post, you can select a rolling return period of your choice by going to our Rolling Return vs Benchmark research tool.

Source: Advisorkhoj Rolling Returns Calculator
You can see that, the fund underperformed versus the benchmark (BSE – 100) till 2009, but it staged a turnaround in 2009 and has consistently outperformed versus the benchmark since then.
In Advisorkhoj, we like funds that are able to sustain consistent rolling return outperformance after a turnaround, since it demonstrates the ability of the fund manager to consistently generate alphas. Alpha, as discussed earlier in our blog, defined as the excess risk adjusted return generated by the fund manager relative to the benchmark and thus, measures of the fund manager’s value add. The alpha of SBI Bluechip Fund is 3.1, while the beta of the fund is less than 1. Beta, defined as the excess returns of the fund over the risk free rate relative to the excess returns of the benchmark index over the risk free rate, is a measure of the risk taken by the fund manager. Beta less than one, implies that the fund manager of SBI Bluechip Fund takes lower risk than the benchmark, BSE – 100.
If you are not familiar with the concepts of Alpha and Beta, you can read our post, How to select the best mutual fund: The importance of Alpha. Funds with high alpha and moderate / low beta are ideal investment options for mutual fund investors.
Portfolio Construction
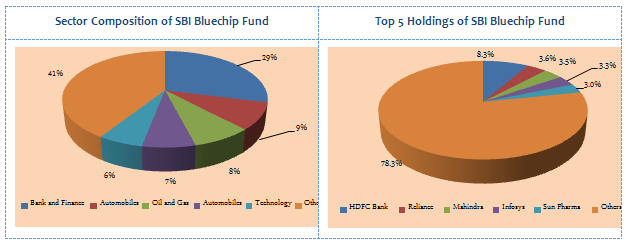
The stated portfolio objective of SBI Bluechip Fund is to invest in stocks of companies whose market capitalization is at least equal to or more than the least market capitalized stock of BSE 100 Index. The fund manager can take cash calls depending on the market situation and on September 30 2016, 85% of the portfolio was invested in stocks, 11% in money market and 4% was in cash / cash equivalents. The sector mix of the fund portfolio is biased towards cyclical sectors like Banking and Finance, Automobiles and Auto Ancillaries, Oil and Gas, Cement etc. The portfolio is well diversified, from a company concentration perspective, with the top 5 stocks, HDFC Bank, Reliance Industries, Mahindra and Mahindra, Infosys and Sun Pharma accounting for 22% of the portfolio value.

Source: Advisorkhoj Research
Growth of र 1 Lakh lump sum investment
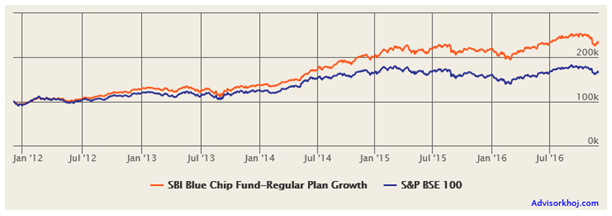
The chart below shows the growth of र 1 Lakh lump sum investment in SBI Bluechip Fund over the last 5 years.

Source: Advisorkhoj Research
You can see that a lump sum investment of र 1 Lakh would have grown to over र 2.3 Lakhs in the last 5 years; a profit of र 1.3 Lakhs.
Monthly SIP Return
The chart below shows the return of र 5,000 monthly SIP in the fund over the last 5 years.

Source: Advisorkhoj Research
You can see that you could have accumulated a corpus of nearly of र 4.6 Lakhs with a monthly SIP of र 5,000 in the last 5 years. You would have made a profit of over र 1.5 Lakhs on a cumulative investment of around र 3 Lakhs.
Conclusion
SBI Bluechip Fund completed 10 years earlier this year. Though the performance of the fund in the initial years was a bit indifferent, its performance in the last 5 years (in different market conditions) has been quite outstanding. Investors should consult with their financial advisors, if SBI Bluechip Fund is suitable for their mutual fund investment portfolios.
Mutual Fund Investments are subject to market risk, read all scheme related documents carefully.
Queries
-
What is the benefit of mutual fund STP
Aug 29, 2019
-
How much to invest to meet target amount of Rs 2 Crores
Aug 26, 2019
-
Can I achieve my financial goals with my current mutual fund investments
Aug 24, 2019
-
Can you tell me return of various indices
Aug 19, 2019
-
What would be the post tax return on different investments
Aug 18, 2019
-
Which Principal Mutual Fund scheme will be suitable for my retirement corpus
Aug 16, 2019
-
What is the minimum holding period for availing NCD interest
Aug 4, 2019
Top Performing Mutual Funds
Recommended Reading
Fund News
-
Kotak Mahindra Mutual Fund launches Kotak Nifty Top 10 Equal Weight Index Fund
Apr 7, 2025 by Advisorkhoj Team
-
Reciprocal Tariffs: Casting a wider net
Apr 7, 2025 by Axis Mutual Fund
-
Kotak Mahindra Mutual Fund launches Kotak Energy Opportunities Fund
Apr 3, 2025 by Advisorkhoj Team
-
Groww Mutual Fund launches Groww Nifty 500 Momentum 50 ETF FOF
Apr 3, 2025 by Advisorkhoj Team
-
Groww Mutual Fund launches Groww Nifty 500 Momentum 50 ETF
Apr 3, 2025 by Advisorkhoj Team


