Nippon India Multi Asset Fund NFO Review

Why you should invest in multiple asset classes?
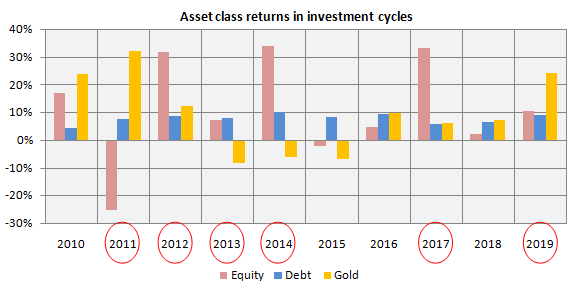
Different asset classes have different risk / return characteristics and give different returns in different market conditions. The chart below shows calendar year returns of different asset classes over the last 10 years; BSE 100 TRI is used as the proxy for equity, CRISIL Short term Bond Fund Index for debt and MCX Gold futures for Gold.
You can see that in the last 10 calendar years, equity was the winner in 4 years (2012, 2014 and 2017), debt was winner in 2 years (2013 and 2015) and gold was the winner in 5 years (2010, 2011, 2016, 2018 and 2019). You can also see that, there can be considerable divergence in relative performances of different asset classes – see the years in the chart circled in red. Therefore, it is important to invest in multiple asset classes to reduce portfolio volatility and optimize returns in different market conditions. It is also important to note that investors usually think of asset allocation in terms of equity and debt but the chart below clearly shows that commodities especially gold can and usually does outperform both equity and debt by a big margin across investment cycles. Hence, multi asset allocation strategy involves more than 2 asset classes.
Source: Nippon India Mutual Fund
Benefits of multi-asset allocation
- Asset classes follow different cycles over different time periods
- It is difficult to predict which Asset class will outperform
- Asset allocation is the key driver of portfolio returns. According to a Study in 2001, “Does Asset Allocation Policy Explain 40%, 90% or 100% of Performance?”, it was statistically proven that more than 90% of the portfolio returns are based on asset allocation decisions.
- Helps in Portfolio Diversification
- Leads to Optimal Returns
Nippon India Multi Asset Fund
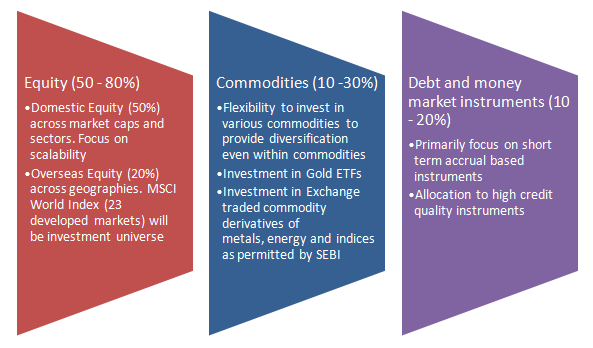
Nippon India AMC is launching a hybrid multi asset fund which will invest in Equity, Debt and Exchange Traded Commodity Derivatives and Gold ETFs. The investment strategy of the scheme is as follows:-
Back testing model portfolio performance
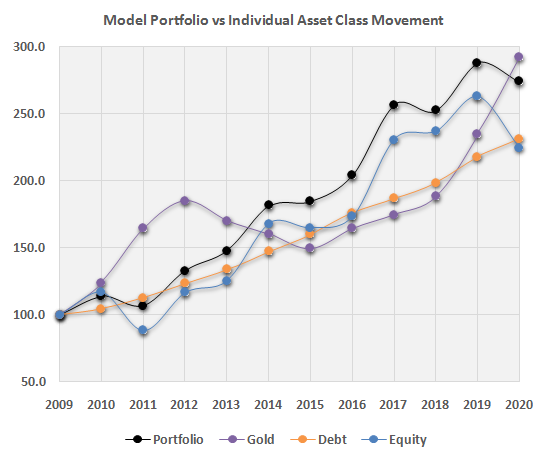
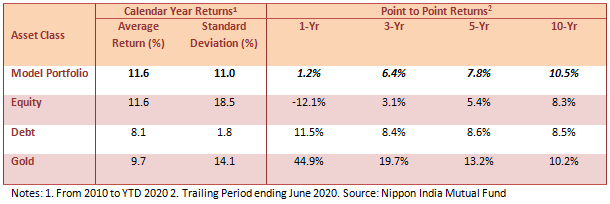
Nippon India AMC has back-tested the performance of their model portfolio versus performance of individual asset classes over the last 10 years up till June 2020. The model portfolio for the purpose of back testing comprised of the following asset classes:-
- Equity (domestic) - S&P BSE 100 TRI (25%)
- Equity (domestic) - S&P BSE Midcap TRI (25%)
- Equity (overseas) - MSCI World Net Return Index (in INR terms) (20%)
- Commodities - Gold Futures prices from MCX (10%)
- Commodities - Crude Oil prices (in INR terms) (5%)
- Debt - CRISIL Short Term Bond Fund Index (15%);
Source: Nippon India Mutual Fund
Portfolio Diversification – Weak correlation between asset classes
The table below shows the correlation of returns of different asset classes. Please note that a correlation coefficient of +1 or close to +1 show strong positive correlation between two asset classes i.e. prices of such asset classes rise or fall together. A correlation coefficient of -1 or close to -1 show strong inverse or negative correlation between two such asset classes i.e. prices of such asset classes move in the opposite directions, if price of one asset class move up, the price of the asset class will move down and vice versa. A correlation coefficient of close to 0, either positive or negative, indicate weak correlation, i.e. price of such asset classes move independently, upward or downward movement of one asset class has no bearing on the price movement of the other asset class. Weak or negative correlation between asset classes is good for portfolio diversification. You can see that correlations between the 4 asset classes are weak or negative. These make them excellent candidates for portfolio diversification.
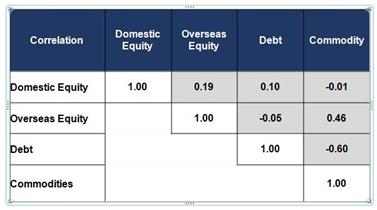
Source: Nippon India Mutual Fund
Why invest in Nippon India Multi Asset Fund NFO
- Fund seeks to provide diversification across asset classes with an aim to provide superior risk adjusted returns. Suggested reading: Importance of Portfolio diversification
- Fund also offers diversification under respective asset classes
- Benefit from Tax efficiency through rebalancing within the Fund
- A one stop solution which may help to reap benefit of Growth of Equity, Stability of Debt & Diversification from Commodities
Conclusion
In these uncertain times multi-asset allocation strategy will reduce portfolio volatility, provide stability and also ensure optimal returns for your long term financial objectives. You should have moderately high risk appetite and long investment tenures of at least 3 to 5 years for this fund. You should consult with your financial advisor if the upcoming NFO is suitable for your investment needs. Please read all scheme related documents carefully before investing.
Mutual Fund Investments are subject to market risk, read all scheme related documents carefully.
Queries
-
What is the benefit of mutual fund STP
Aug 29, 2019
-
How much to invest to meet target amount of Rs 2 Crores
Aug 26, 2019
-
Can I achieve my financial goals with my current mutual fund investments
Aug 24, 2019
-
Can you tell me return of various indices
Aug 19, 2019
-
What would be the post tax return on different investments
Aug 18, 2019
-
Which Principal Mutual Fund scheme will be suitable for my retirement corpus
Aug 16, 2019
-
What is the minimum holding period for availing NCD interest
Aug 4, 2019
Top Performing Mutual Funds
Recommended Reading
Fund News
-
DSP Mutual Fund launches DSP Nifty Next 50 ETF
Dec 19, 2025 by Advisorkhoj Team
-
DSP Mutual Fund launches DSP Nifty 500 Index Fund
Dec 19, 2025 by Advisorkhoj Team
-
Kotak Mahindra Mutual Fund launches Kotak Nifty Next 50 ETF
Dec 18, 2025 by Advisorkhoj Team
-
The Wealth Company Mutual Fund launches The Wealth Company Gold ETF
Dec 16, 2025 by Advisorkhoj Team
-
Axis Mutual Fund launches Axis Gold and Silver Passive FOF
Dec 10, 2025 by Advisorkhoj Team


