Nippon India Growth Fund: The greatest wealth creator

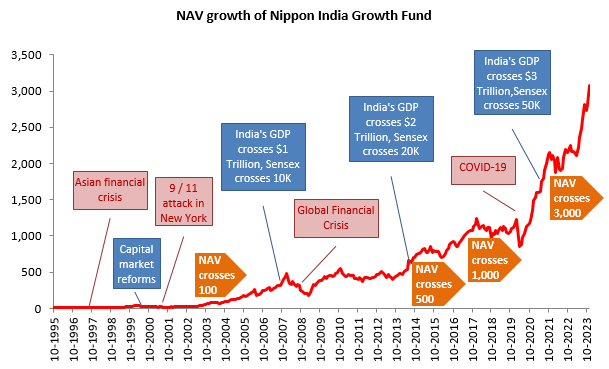
If you invested Rs 1 lakh in Nippon India Growth Fund at the time of its launch 28 years back, your investment would have grown to over Rs 3 crores. Nippon India Growth Fund’s journey is also largely a part of India’s economic growth post liberalization. From some of the worst economic and financial crises the world has ever seen, to major economic milestones, Nippon India Growth Fund has seen all the major macro events over the past 28 years (see the chart below).

Source: Advisorkhoj.com, as on 12th December 2023
Phenomenal alpha creation
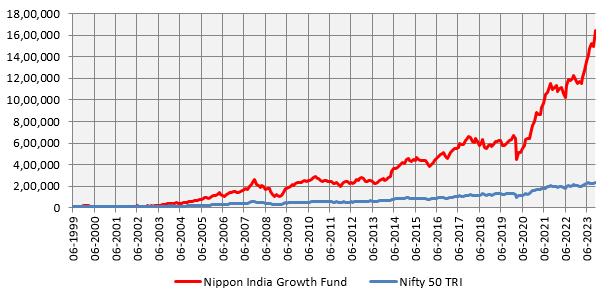
The chart below shows the growth of Rs 10,000 investment in Nippon India Growth Fund versus Nifty 50 TRI, since the inception of the index. You can see that Nippon India Growth Fund created massive alpha for investors. Even though the Nifty 50 TRI chart seems flattish, investors should know that the CAGR return of Nifty 50 TRI over this period was nearly 14%. The Nifty chart seems to flattish because the performance of Nippon India Growth Fund over the same period was phenomenal – CAGR of 23%. The chart below shows the power of compounding of equity as an asset class.

Source: Advisorkhoj.com, as on 12th December 2023
Wealth creation through SIP
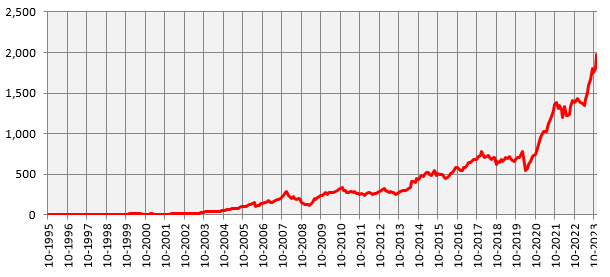
The chart below shows the growth of Rs 10,000 monthly SIP in Nippon India Growth fund since the inception of the fund. With a cumulative investment of around Rs 34 lakhs, you could have accumulated a corpus of nearly Rs 20 crores through SIP. The annualized SIP return (XIRR) of the fund was 23%.

Source: Advisorkhoj.com, as on 12th December 2023
One of the most consistent performers over the last 7 years
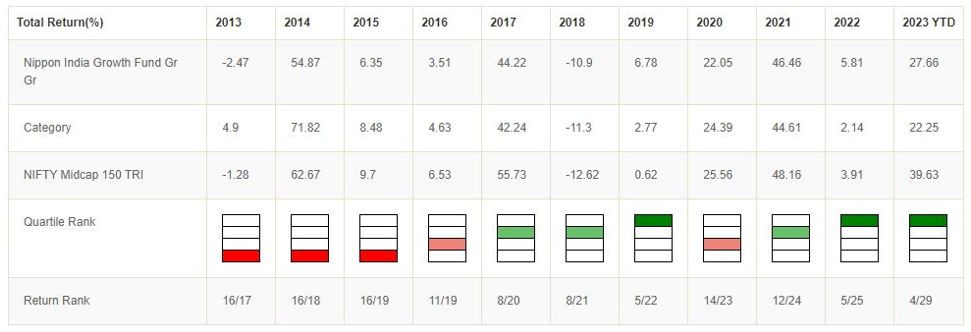
Almost all funds of vintage go through ups and downs. Nippon India Growth Fund also had its ups and downs. The fund has consistently been ranked in the top 2 quartiles in 6 out of the last 7 years. Performance consistency is one of the most important attributes of top performing mutual funds in our opinion. The consistent outperformance of Nippon India Growth Fund versus its peers can be attributed to the stock picking approach of the fund manager and the research capabilities of Nippon India Mutual Fund. The chart below shows the quartile ranking performance of Nippon India Growth Fund over the last 10 years or so.

Source: Advisorkhoj Research, as on 30th November 2023.
About Nippon India Growth Fund
The fund was launched in October 1995 and has over Rs 21,380 crores of assets under management (as on 30th November 2023). The expense ratio of the fund is 1.69%. The fund primarily invests in midcap stocks (currently 70% of the scheme holdings). SEBI classifies 101st to 250th companies by market capitalization as midcap stocks. Rupesh Patel and Sanjay Doshi are the fund managers of this scheme. Both the fund managers have strong long term track record.
Investment philosophy
- Nippon India Growth Fund predominantly invests in mid cap companies that have the potential to compound and substantially increase their profitability over a period of time.
- The fund endeavours to identify potential market leaders at an early stage with a view to create long term alpha.
- Focus is on 4 verticals which typically may grow faster than the economy – these are consumer discretionary, healthcare, financials and outsourcing to global corporations.
- The fund follows bottom up stock selection with no style bias
Why invest in Nippon India Growth Fund?
In the US Federal Reserve meeting on 13th December, the central bank indicated that it will not hike interest rates going forward. In fact, the Fed indicated that it may cut interest rates 3 times in 2024. US bond yields declined and global equity markets have rebounded. With global risk-on sentiments, a lot of global fund flows will continue to come to India, as we are the best performing major economy. With over $4 trillion of market cap, India stock market is the fifth largest market in the world. India has been included in global debt indices (e.g. JP Morgan EM Bond index etc).
In view of substantial infusion of global liquidity in Indian capital markets, we are likely to see a situation where money is struggling to find companies worth investing in, in other words, great time for midcaps. Nippon India Growth Fund has a strong track record of wealth creations and generating alphas for investors across market cycles.
Who should invest in Nippon India Growth Fund?
- Investors looking for capital appreciation over long investment horizons.
- Investors with high-risk appetite – the scheme can be highly volatile in the short term.
- Investors with minimum 5 years investment tenures.
- You can invest either in lump sum or SIP depending on your financial needs.
Consult your Mutual fund distributor or financial advisor to understand more about Nippon India Growth Fund and how to invest in it.
Mutual Fund Investments are subject to market risk, read all scheme related documents carefully.
Queries
-
What is the benefit of mutual fund STP
Aug 29, 2019
-
How much to invest to meet target amount of Rs 2 Crores
Aug 26, 2019
-
Can I achieve my financial goals with my current mutual fund investments
Aug 24, 2019
-
Can you tell me return of various indices
Aug 19, 2019
-
What would be the post tax return on different investments
Aug 18, 2019
-
Which Principal Mutual Fund scheme will be suitable for my retirement corpus
Aug 16, 2019
-
What is the minimum holding period for availing NCD interest
Aug 4, 2019
Top Performing Mutual Funds
Recommended Reading
Fund News
-
Axis Mutual Fund launches Axis Gold and Silver Passive FOF
Dec 10, 2025 by Advisorkhoj Team
-
Jio BlackRock Mutual Fund launches JioBlackRock Arbitrage Fund
Dec 9, 2025 by Advisorkhoj Team
-
Tata Mutual Fund launches Tata BSE Multicap Consumption 50:30:20 Index Fund
Dec 9, 2025 by Advisorkhoj Team
-
Edelweiss Mutual Fund launches Edelweiss Silver ETF Fund of Fund
Dec 8, 2025 by Advisorkhoj Team
-
Abakkus Mutual Fund launches Abakkus Liquid Fund
Dec 8, 2025 by Advisorkhoj Team


