Is this the opportune time to invest in midcap equity mutual funds

What are midcap funds and their characteristics?
Midcap mutual funds are equity mutual fund schemes which invest at least 65% of their assets in midcap stocks. SEBI classifies the top 100 stocks by market capitalization as large cap stocks, the next 150 stocks as midcap and the remaining ones as small cap stocks. Large cap stocks are characterized by market leadership in their respective industry sectors, established business models with long track records, large balance sheets and wide public shareholding, particularly institutional shareholding. Large cap stocks are expected to deliver stable returns with relatively low volatility compared to midcaps and small caps.
Small cap companies, on the other hand, are largely entrepreneur owned and managed, with business models that can evolve considerably and are nimble enough to adapt to emerging opportunities. Some good small companies have their unique competitive strengths but are still in relatively early stages of growth. As such these companies have high earnings growth potential but may be more vulnerable in economic downturns, which makes small cap stocks more volatile than large cap stocks.
Midcap stocks occupy the sweet spot between large and small caps. Like small cap stocks, midcaps are largely entrepreneur driven, are leaders in small industry sectors and occupy niches in established sectors. Midcap funds have higher growth potential than large cap funds but have lower downside risks compared to small cap funds. As per our internal research, midcap mutual funds gave on average 13.8% CAGR returns in the last 10 years versus large cap average returns of 10.5% CAGR. In 2019 (year to date), while small cap funds gave -1.4% returns, midcap funds gave 2.4% returns.
How midcaps have created wealth for investors?
Regular Advisorkhoj readers know that mutual fund performance is linked with market conditions prevailing over the performance period. From 2014 to 2017, midcap funds outperformed large caps by a wide margin, giving superlative returns to investors. From 2018, midcaps have underperformed large caps. We have repeatedly stated that investors should never try to speculate market movements in the short term and you should always have long investment horizons for equity investments because historical data shows that equity as an asset class, over long investment horizons produced inflation beating returns, outperformed other asset classes and created wealth for investors.
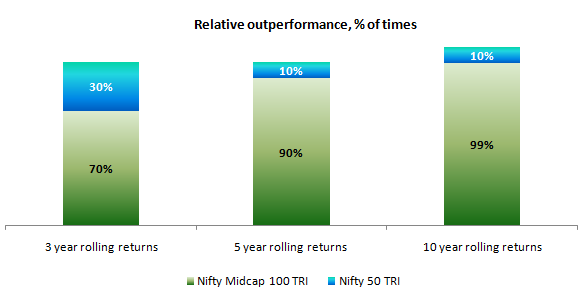
Historical data also shows that midcaps have usually outperformed large caps, over long investment tenures, across different market conditions. Our regular readers know that rolling returns are the most unbiased measured of mutual fund performance across different market conditions. Nifty Midcap 100 TRI (benchmark of midcap stocks) have outperformed Nifty 50 TRI (benchmark of 50 largest cap stocks) in terms of 3 years, 5 years and 10 year rolling returns – longer the investment tenure (rolling returns period), superior is the outperformance (please see the chart below).

Source: Advisorkhoj Research
The table below will show to you, why midcaps have stronger credentials as wealth creators compared to large caps.
Over 5 and 10 year investment tenures, both large caps and midcaps created wealth for investors most of the times, giving more than 8% annualized returns. For benefit of investors who are new to our website, the long term yield of 10 year Government Securities is around 8%. While yields can change depending on the interest rate environment, investors usually expect around 7 – 8% returns from fixed income investments in the long term.

*TRI, Source: Advisorkhoj Returns
Large caps (Nifty) gave more than 8% returns, nearly 80% of the times over 5 year tenures and 96% of times over 10 year tenures. Midcaps gave more than 8% returns, 85% of the times over 5 year tenures and 100% of the times over 10 year tenures.
Midcaps gave over 15% CAGR returns, more than 50% of the times over 5 – 10 year investment tenures. Extrapolating historical data, midcaps have the potential to give minimum 12 – 13% returns over 10 year plus tenures – multiply your wealth 3 times. Investors should however note that, historical returns can serve as indicators and by no means, provide assurance of any kind.
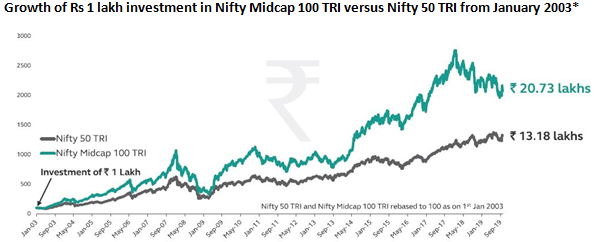
The chart below shows the historical wealth creation by midcaps (as represented by Nifty Midcap 100 TRI) versus large cap (as represented by Nifty 50 TRI) over the last 16 – 17 years.
Midcap investment would have multiplied your money more than 2 times, while large cap would have grown 1.3 times – midcap created 57% more wealth than large cap.
Investors should remember that midcap fund managers are tasked with beating the benchmark index and create alphas; many midcap funds over this period would have outperformed the midcap index. Investors should also understand that midcap fund managers are better positioned to create bigger alphas because of lower institutional ownership of midcap stocks and less efficient price discovery compared to large caps.

*Till 30th September 2019
Why invest in Midcap now?
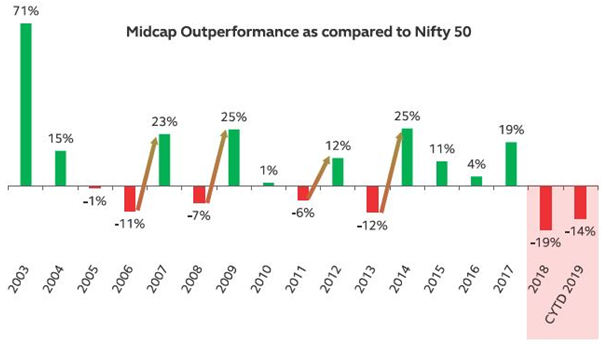
The last 2 years have been harsh for the midcap and small cap segments of the stock market. Nifty Midcap 100 TRI fell 19% in 2018 and has fallen 14% on an YTD (as on 30th September 2019) basis. In the past, correction or underperformance in midcap (versus large cap) was always followed by a bounce back and outperformance (please see the chart below). You can see the outperformance was always stronger than preceding underperformance; such is the nature of midcaps.

It is true that the midcap underperformance that we are seeing for almost two years has been much bigger in magnitude and more prolonged than in the past, but you should understand the current midcap underperformance in context of the exceptional performance of midcaps from 2014 to 2017 end. Investors who have been following our blog for the past few years will know that, we were warning about extraordinarily high valuations of midcaps in 2017, when exuberance was at its peak in this segment without corporate earnings justifying the irrational optimism.
With benefit of hindsight, we can say that the irrational exuberance we saw in 2017 was not an entirely new phenomenon; just that it went on for too long. We had seen this before in 2007 and we saw the consequences in 2008, just like we did 10 years later. We stated earlier in our blog that the market is ruthless and will punish excessive risk taking without fundamentals supporting over optimistic outlook; midcaps have fallen more than 25% in the last 2 years, while Nifty rose 13%. But now the moot question is, how long with the midcap underperformance continue?
Valuations are attractive now
At the end of the day, investing is all about the value of the asset you are buying. Midcaps usually trade at a discount to large caps in terms of valuations (P/E ratio) because large caps are less volatile (risky) than midcaps.
The chart below shows the historical valuations of midcaps versus large cap. You can see that for most periods over the last 15 years or so, large caps were trading at premium (higher P/E ratios) compared to midcaps, but the situation reversed in the middle of 2015 and by 2017, midcaps were trading at a huge premium to large caps. However, in the past one year or so the midcap P/E has corrected from 25.6 times earnings to 15.9 times (as on 30th September 2019). You can see than midcaps are now trading at discount to large caps.

Source: MotilalOswal Research
Mean reversion is a classic characteristic of asset valuations in a long term secular trend. The chart below shows mean reversion in action for midcap valuations versus large cap over the past 13 – 14 years. Midcap valuation discount versus large cap reverted back to historical averages. In fact midcap valuations relative to large cap now are at levels from which we saw very strong midcap outperformance in the past. Compare the current midcap valuation discount with early 2014 (before the onset of the pre-election Modi wave of 2014) valuation; this can be a strong valuation level from where we can see potential; midcap outperformance over a sufficiently long investment horizon, short term interim volatility notwithstanding.

Source: MotilalOswal Research
Conclusion
In this blog post, we discussed about midcap mutual funds in the context of their fundamental characteristics, historical wealth creation potential over long investment horizons and the current situation after the sharp correction over the last 2 years. We will recap the main points below:-
- Midcap funds are good investment options for investors with high risk appetites looking to create wealth over long investment tenures
- Historically, midcap funds have created substantial wealth for investors over long investment horizons (5 to 10 years, or longer)
- Midcaps have corrected sharply over the last 2 years or so and now priced at levels from which we saw excellent recovery and strong returns for investors in the past
Investors should consult with their financial advisors if they should allocate a portion of their money to midcap funds in their portfolio for their long term financial goals.
To know more about Principal Midcap Fund click to the below Link
https://www.principalindia.com/mutual-fund-list/nfo-mutual-funds/principal-mid-cap-fund
To hear Ravi Gopalakrishnan about the Principal Midcap Fund click to the below Link
Mutual Fund Investments are subject to market risk, read all scheme related documents carefully.
Queries
-
What is the benefit of mutual fund STP
Aug 29, 2019
-
How much to invest to meet target amount of Rs 2 Crores
Aug 26, 2019
-
Can I achieve my financial goals with my current mutual fund investments
Aug 24, 2019
-
Can you tell me return of various indices
Aug 19, 2019
-
What would be the post tax return on different investments
Aug 18, 2019
-
Which Principal Mutual Fund scheme will be suitable for my retirement corpus
Aug 16, 2019
-
What is the minimum holding period for availing NCD interest
Aug 4, 2019
Top Performing Mutual Funds
Recommended Reading
Fund News
-
DSP Mutual Fund launches DSP Nifty Next 50 ETF
Dec 19, 2025 by Advisorkhoj Team
-
DSP Mutual Fund launches DSP Nifty 500 Index Fund
Dec 19, 2025 by Advisorkhoj Team
-
Kotak Mahindra Mutual Fund launches Kotak Nifty Next 50 ETF
Dec 18, 2025 by Advisorkhoj Team
-
The Wealth Company Mutual Fund launches The Wealth Company Gold ETF
Dec 16, 2025 by Advisorkhoj Team
-
Axis Mutual Fund launches Axis Gold and Silver Passive FOF
Dec 10, 2025 by Advisorkhoj Team


