ICICI Prudential Technology: The best technology fund over the years

Savvy investors who have been following the equity markets would have surely observed that certain industry sectors outperform the market over certain market cycles. Over the last 3 years, the IT sector has outperformed the market. The chart below shows the monthly price movements of the CNX IT Index (the Index for IT stocks) and the Nifty, indexing prices of both the indices on May 10 2011 to zero.
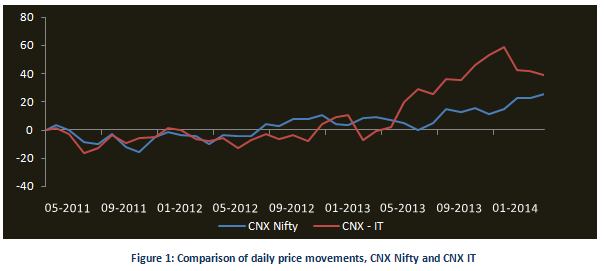
The chart clearly shows that the IT sector has outperformed the Nifty, through most of the last three year period, except in the second half of 2012 and very recently over the last few months. The primary reason for the outperformance has been the depreciation of the Rupee versus the US dollar which made the Indian IT sector competitive, in addition to the organic growth in dollar terms for the IT companies.
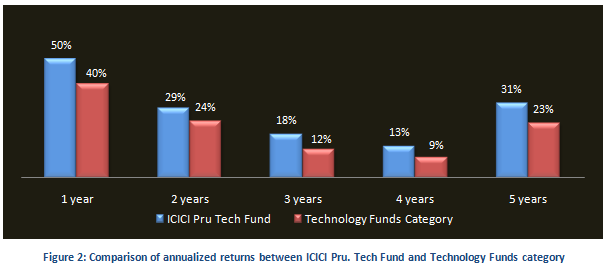
In this article, we will review the top performing technology fund based on last 3, 5 and 10 years performance. This fund from ICICI Prudential stable, one of the largest asset management companies in India with top performers across several mutual fund categories, has outperformed its peers in the technology fund category by a large margin, over both short and medium term. See the chart below for the trailing annualized returns of the ICICI Prudential technology fund and the technology funds category over the 3 to 5 year time periods. NAVs as on May 10.
ICICI Prudential Technology Fund – Fund Overview
This fund is suitable for well informed active investors looking for good investment opportunities in the short to medium term, especially if the broader market returns are weak in the same time horizon. The fund was launched in Jan 2000. It has an AUM base of about Rs 220 crores. The expense ratio of this fund is slightly on the higher side at 2.69%. The fund manager of this scheme is Mrinal Singh. The scheme is open both for growth and dividend plans. The current NAV (as on May 10 2014) is 29.93 for the growth plan and 25.34 for the dividend plan.
Portfolio Construction
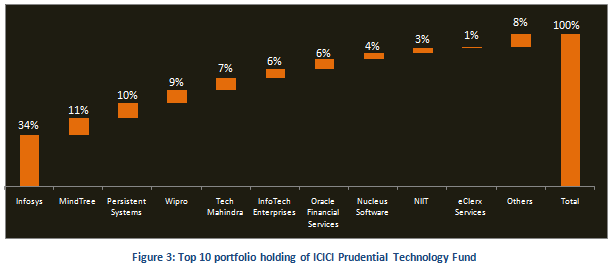
The fund invests in basket of technology stocks, with a large cap and high growth focus. The portfolio is concentrated in high quality technology stocks, with Infosys, MindTree, Persistent Systems, Wipro and Tech Mahindra comprising over 70% of the portfolio holdings. Overall there are thirteen stocks in the ICICI Prudential Technology fund portfolio. The portfolio also holds about 9% in cash equivalents as a cushion against volatility and downside risks. The chart below shows the top 10 holdings of the fund portfolio.
Risk & Return
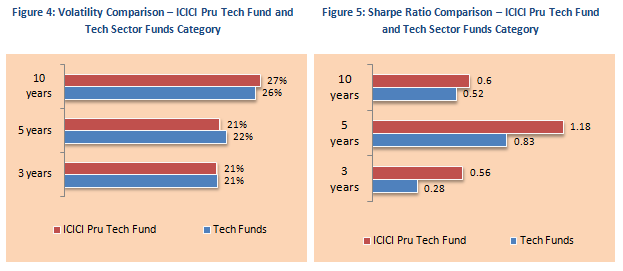
From a risk perspective, the volatility of the ICICI Prudential Technology fund is in line with the technology sector funds category. The annualized standard deviations of monthly returns of the fund for three, five and ten year periods are in the range of 21% to 27%, which is in line with the standard deviations of technology sector funds category over the same time periods. While the volatility of the fund is in line with that of the category, the returns over the three to five time periods are higher than the technology sector funds category (see Figure 2). This makes a fund a strong performer and an attractive pick for investors from a risk reward perspective. On a risk adjusted basis, as measured by Sharpe Ratio, the fund has outperformed the technology sector funds category. Sharpe ratio is defined as the ratio of excess return (i.e. difference of return of the fund and risk free return from Government securities) and annualized standard deviation of returns. Higher the Sharpe ratio better is the risk adjusted performance of the fund. In fact, over 3 years the Sharpe ratio of ICICI Prudential Technology Fund is almost twice of the technology sector funds category. This means that this fund has given two times risk adjusted returns, as compared to the technology sector funds category. See charts below for comparison of volatilities and Sharpe ratios between ICICI Prudential Technology fund and the technology sector funds category.
Comparison with Peer Set
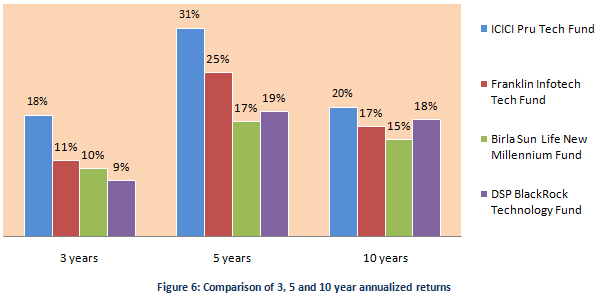
A comparison of annualized returns of the ICICI Prudential Technology fund versus its peer set over three, five and ten year time periods shows why this fund is considered a top pick in its category. The fund has outperformed all its peers, across all time scales. See chart below for comparison of trailing annualized returns over three, five and ten year time periods. NAVs as on May 10 2014.
Lump Sum and SIP Returns
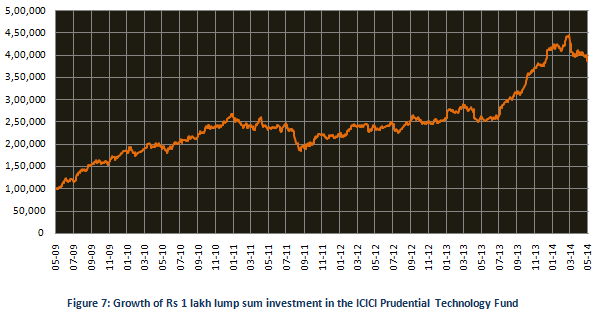
The chart below shows the growth of Rs 1 lakh lump sum investment in the ICICI Prudential Technology fund over the last 5 years. A lump sum investment of Rs 1 lakh 5 years back, would have by now (May 10 2014) grown to nearly Rs 4 lakhs. Your investment would have doubled in less than a year and tripled in little over 4 years.
The chart below shows the returns over the last 5 years, of Rs 3000 monthly SIP in the ICICI Prudential Technology fund. The SIP date has been assumed to first working day of the month.
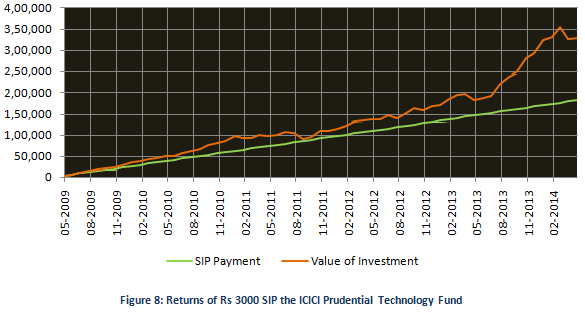
The chart above shows that a monthly SIP of Rs 3000 started 5 years back in the ICICI Prudential Technology fund would have grown to over Rs 3.2 lakhs, while the investor would have invested in total only Rs 1.8 lakhs. The SIP returns (XIRR) is nearly 24%.
Conclusion
The ICICI Prudential Technology Fund has delivered over 10 years of strong performance. The fund has performed well in the short term, medium term and long term. Investors with high risk appetite and moderate time horizon can consider buying the scheme through the systematic investment plan (SIP) or lump sum route. Investors should also ensure that the objectives of the fund are aligned with their individual risk profiles and time horizons. Investors should note that thematic funds such as this, however, are suitable only for those investors who can monitor market trends and book profits at the right time.
Queries
-
What is the benefit of mutual fund STP
Aug 29, 2019
-
How much to invest to meet target amount of Rs 2 Crores
Aug 26, 2019
-
Can I achieve my financial goals with my current mutual fund investments
Aug 24, 2019
-
Can you tell me return of various indices
Aug 19, 2019
-
What would be the post tax return on different investments
Aug 18, 2019
-
Which Principal Mutual Fund scheme will be suitable for my retirement corpus
Aug 16, 2019
-
What is the minimum holding period for availing NCD interest
Aug 4, 2019
Top Performing Mutual Funds
Recommended Reading
Fund News
-
RBI Monetary Policy: RBI changes policy stance and lowers rate
Apr 9, 2025 by Axis Mutual Fund
-
Kotak Mahindra Mutual Fund launches Kotak Nifty Top 10 Equal Weight Index Fund
Apr 7, 2025 by Advisorkhoj Team
-
Reciprocal Tariffs: Casting a wider net
Apr 7, 2025 by Axis Mutual Fund
-
Kotak Mahindra Mutual Fund launches Kotak Energy Opportunities Fund
Apr 3, 2025 by Advisorkhoj Team
-
Groww Mutual Fund launches Groww Nifty 500 Momentum 50 ETF FOF
Apr 3, 2025 by Advisorkhoj Team


