Choose Best Mutual Funds wisely: A big performance differential between top and bottom performers

Mutual fund investors in India have a large number of options to choose from. There are hundreds of schemes from a large number of fund houses across a variety of categories, which makes it a difficult task for the investors to choose a fund. The first step of an investment process is to determine your risk tolerance level. Before selecting a fund, Investors should choose the category of fund(s) they want to invest in, depending on their risk profiles, investment horizons and investment objectives. Different mutual fund categories have different risk levels. For example, small and midcap funds are riskier than large cap, whereas equity funds in general are riskier than debt funds. Investors with longer investment horizons should choose equity funds over debt funds. Within equity funds, depending on your time horizon and risk profile, you can choose between different fund categories, say a diversified equity fund versus a thematic fund. Investors, who want to save taxes, should choose Equity Linked Savings Schemes (ELSS), which qualify for tax deduction under Section 80C. Depending on your investment objectives, you should decide which category of funds (e.g. large cap funds, diversified equity funds, small and midcap funds, ELSS, thematic funds, FMPs, liquid funds, short term debt funds, long term debt funds etc.) you should invest in. But even within a specific category, investors should choose a fund that gives the best returns on investment. It takes considerable expertise and effort to identify top performing funds. Therefore, investors should engage good financial advisers, who can suggest top performing funds that the investor can consider investing in.
There is a big performance differential between top and bottom performers, across various fund categories. Therefore, investors should make sure, that they invest in top performing funds. In this article, we will examine this in more details. It is not fair to compare funds across categories, because they have different investment objectives. To study performance differential between different funds, we will examine funds within different categories. In order to study the relative performance of mutual funds versus their peers within a particular category, we will put funds in different quartiles, depending on their relative performance. Quartiles of a ranked set of fund returns are subdivisions that divide the funds into four roughly equal groups. Funds in the top quartile were top performers in their categories and those in the bottom quartile were the bottom performers. In between the top and bottom quartiles, we have the two middle quartiles, the third quartile and the second quartile. Funds in the third quartile, did not give as much returns as the top quartile funds in their categories, but performed better than the second quartile funds. Funds in the second quartile, did not give as much returns as the third quartile, but performed better than the bottom quartile funds. In this article, we will not discuss funds in particular, but we will examine how funds in different quartiles performed on an average versus other quartiles in the same categories. Let us start with large cap funds.
Large Cap Funds
The mean annualized trailing return of large cap funds across the 1, 3 and 5 year timeframes, are 17%, 6% and 16% respectively. The standard deviations of returns across different large cap funds during the same timeframes are 8%, 2.5% and 3% respectively. Clearly there is a big deviation in returns within different funds in this category. Please see the chart below, for the average annualized trailing returns for the different quartiles of large cap funds across different time periods.
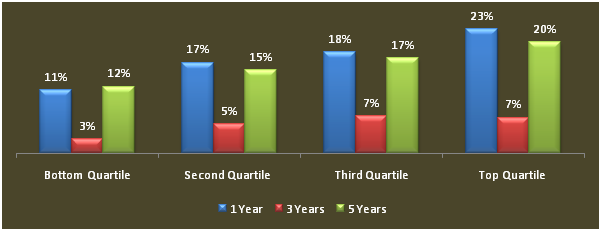
As you can see, the top quartile funds beat the returns of the bottom quartile funds by a big margin, in the one to five year time periods. Over a five year period a fund in the top quartile, would have given 75% higher total returns than a fund in the bottom quartile. That is a substantial difference in returns. From a long term wealth creation perspective, you should try to ensure that you choose a fund from the top quartile.
Diversified Equity Funds
The mean annualized trailing return of diversified equity funds across the 1, 3 and 5 year timeframes, are 21%, 6% and 18% respectively. The standard deviations of returns across different diversified equity funds during the same timeframes are 8%, 4% and 4% respectively. Clearly there is a big deviation in returns within different funds in this category. Please see the chart below, for the average annualized trailing returns for the different quartiles of diversified equity funds across different time periods.
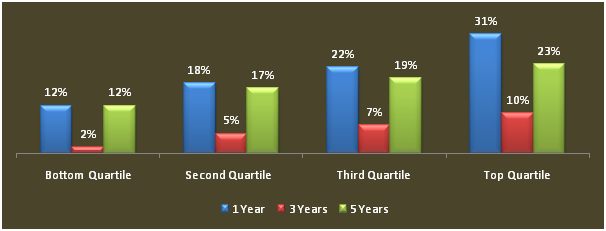
As you can see, the top quartile funds beat the returns of the bottom quartile funds by a big margin, in the one to five year time periods. Over a five year period a fund in the top quartile, would have given more than 100% higher total returns than a fund in the bottom quartile. That is a substantial difference in returns. The performance range is wider in diversified equity funds, because there is a bigger universe of stocks that go into diversified equity portfolio, compared to large cap funds. From a long term wealth creation perspective, you should ensure that you choose a fund from the top quartile.
Equity Linked Savings Scheme
The mean annualized trailing return of ELSS funds across the 1, 3 and 5 year timeframes, are 21%, 6% and 18% respectively. The standard deviations of returns across different ELSS funds during the same timeframe are 8%, 3% and 3%, respectively. Clearly there is a big deviation in returns within different funds in the category. Please see the chart below, for the average annualized trailing returns for the different quartiles of ELSS funds across different time periods.
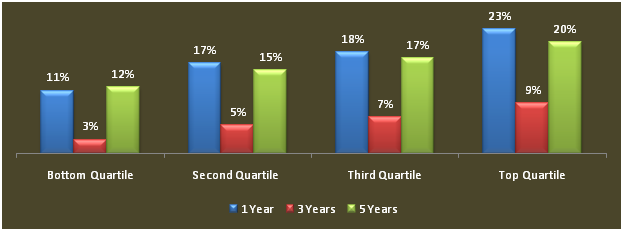
As you can see, the top quartile funds beat the returns of the bottom quartile funds by a big margin, in the one to five year time periods. Over a five year period a fund in the top quartile, would have given more than 75% higher total returns than a fund in the bottom quartile. That is a substantial difference in returns. From a long term wealth creation perspective, you should ensure that you choose a fund from the top quartile.
Small and Midcap Funds
The mean annualized trailing return of small and midcap funds across the 1, 3 and 5 year timeframes, are 30%, 10% and 24% respectively. The standard deviations of returns across different small and midcap funds during the same timeframe are 8%, 4% and 4%, respectively. Clearly there is a big deviation in returns within different funds in the category. Please see the chart below, for the average annualized trailing returns for the different quartiles of small and midcap funds across different time periods.
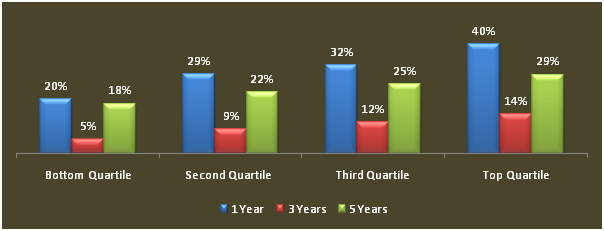
As you can see, the top quartile funds beat the returns of the bottom quartile funds by a big margin, in the one to five year time periods. Over a five year period a fund in the top quartile, would have given more than 125% higher total returns than a fund in the bottom quartile. That is a substantial difference in returns. The performance range is wider in small and midcap funds compared to large cap, diversified equity and ELSS funds, because there is a bigger universe of stocks that go into small and midcap portfolio, compared to the other categories. From a long term wealth creation perspective, you should ensure that you choose a fund from the top quartile.
Thematic Funds
Intuitively the performance differential in thematic funds should be lower, because these funds only invest in a specific sector. Nevertheless, we can observe performance of different funds even within the thematic funds.
Thematic Funds – Tech Funds
The mean annualized trailing return of Tech Funds across the 1 and 3 year timeframes, are 49%, and 12% respectively. The standard deviations of returns across different banking funds during the same timeframe are 6% and 5%, respectively. Clearly there is a deviation in returns within different funds in the category. Please see the chart below, for the average annualized trailing returns of technology funds across different time periods.
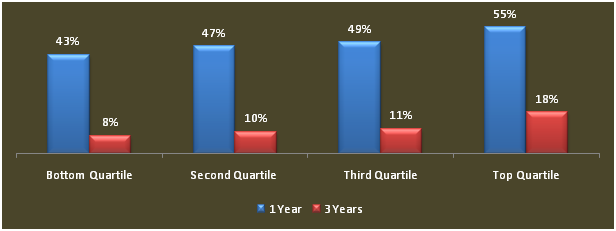
As you can see, the top quartile funds beat the returns of the bottom quartile funds by a significant margin, in the one to three year time periods. Over a three year period a fund in the top quartile, would have given more than 40% higher total returns than a fund in the bottom quartile. The performance range is narrower in the thematic tech funds, compared to large cap, diversified equity, ELSS and small and midcap funds, because there is a smaller universe of stocks that go into thematic funds. From a long term wealth creation perspective, you should ensure that you choose a fund from the top quartile.
Thematic Funds – Banking Funds
The mean annualized trailing return of banking funds across the 1 and 3 year timeframes, are 3%, and 0% respectively. The standard deviations of returns across different banking funds during the same timeframe are 5% and 6%, respectively. Clearly is a deviation in returns within different funds in the category. Please see the chart below, for the average annualized trailing returns of banking funds across different time periods.
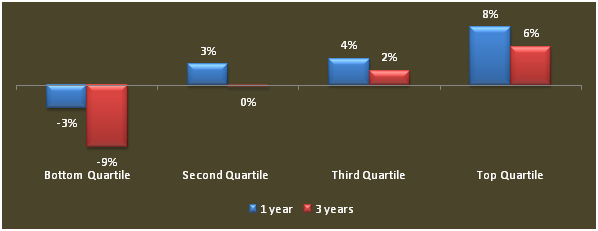
As you can see, the top quartile funds beat the returns of the bottom quartile funds by a significant margin, in the one to three year time periods. Over a five year period a fund in the top quartile, would have given more than 42% higher total returns than a fund in the bottom quartile. The performance range is narrower in the thematic banking funds, compared to large cap, diversified equity, ELSS and small and midcap funds, because there is a smaller universe of stocks that go into thematic funds. From a long term wealth creation perspective, you should ensure that you choose a fund from the top quartile.
Conclusion
In this article we have seen that there is a considerable performance differential between mutual funds. Investors should endeavour to invest in the top quartile funds. However, identifying funds that will perform well in the future is not easy. A good financial adviser will be able help the investors to identify funds in the top quartile, so that they can maximize the return on their investments.
Queries
-
What is the benefit of mutual fund STP
Aug 29, 2019
-
How much to invest to meet target amount of Rs 2 Crores
Aug 26, 2019
-
Can I achieve my financial goals with my current mutual fund investments
Aug 24, 2019
-
Can you tell me return of various indices
Aug 19, 2019
-
What would be the post tax return on different investments
Aug 18, 2019
-
Which Principal Mutual Fund scheme will be suitable for my retirement corpus
Aug 16, 2019
-
What is the minimum holding period for availing NCD interest
Aug 4, 2019
Top Performing Mutual Funds
Recommended Reading
Fund News
-
Zerodha Mutual Fund launches Zerodha Nifty Short Duration G Sec Index Fund
Dec 26, 2025 by Advisorkhoj Team
-
Groww Mutual Fund launches Groww Nifty Chemicals ETF
Dec 26, 2025 by Advisorkhoj Team
-
DSP Mutual Fund launches DSP Nifty Next 50 ETF
Dec 19, 2025 by Advisorkhoj Team
-
DSP Mutual Fund launches DSP Nifty 500 Index Fund
Dec 19, 2025 by Advisorkhoj Team
-
Kotak Mahindra Mutual Fund launches Kotak Nifty Next 50 ETF
Dec 18, 2025 by Advisorkhoj Team


