Understanding the post Budget market rally: Will it be sustainable

When the Finance Minister was mid way through his Budget speech the Nifty fell sharply to the 52 week intraday low of 6,825. By the end of trading session on the Budget day, the Nifty had pulled back 150 points. In the next two trading sessions following the budget, the Nifty has rallied over 350 points and the Sensex has rallied around 1,200 points. For many retail investors this rally is indeed very welcome after seeing declines in their portfolio values over the past one year. At the same, one question that may be in the mind of many investors, especially those who invested in the last one year or so, is whether this rally is sustainable. In this two part blog post we will discuss the following:-
- Market dynamics
- Brief technical analysis of the relief rally
- Global macro outlook
- Domestic macro outlook and impact of Budget
- What should fixed income and equity investors do
Market Dynamics
You should understand that the stock market is a battleground of bulls and bears. Understanding their dynamics is important for investors because, bulls and bears will always be there in the stock markets. A bull makes profits by buying shares and selling them at higher prices. A bear, on the other hand, makes profits by selling shares and then buying them at lower prices. Therefore bulls want share prices to go up, while bears want share prices to go down. Bulls prosper on good news, while bears thrive on bad news. Investors, who are new to the market, should understand that, though the media likes to project a set of investors as bulls and another set as bears, there are no designated bulls or bears in the stock market. I can be a bear today and a bull tomorrow. It really depends on how I want to make money in the market, whether by buying (going long in finance parlance) or selling (going short in finance parlance). We had discussed earlier, that an operator is a bull or bear based on his or her expectations with respect to share prices. There is always a tussle between bulls and bears in the market. When bears sell bulls buy and when bulls buy bears sell. This is what determines demand and supply in the market. When bears are in control, the market goes down and when bulls are in control the market goes up. Since the beginning of this year, bears were in total control of the stock market. The global sentiment was not good. FIIs continued to sell off in India along with other emerging markets. In January 2016 itself FIIs sold more र 10,000 crores of Indian equities, the worst since 2008. Bear operators made easy money by trading on the short side in the Futures and Options market. Futures and Options average daily turnover in January, as per National Stock Exchange data, was nearly र 300,000 crores, the highest in one year. Huge volume of trading in index (Nifty, Bank Nifty etc) options was seen among FIIs. While traders can make a lot of money trading in futures and options, they have to be careful when major support or resistance levels are near. We had discussed in our post, Where will the stock market bottom out: A technical perspective, that 6800 on Nifty was a major support level. However, it seems that some bear operators were so emboldened by the weakness in the sentiments that they continued to build short positions right up to even the Budget day. Excessive greed more often than not leads to excessive losses, as I am sure, some short traders would have realized, on the day after the budget.
Another interesting observation about the market which investors would do well to remember is that, expectations on an event (Budget in this case) are built based on what dominant trades in the market are. Since the big trades in January or February were on the short side, expectations were built that the fiscal deficit target will be increased in the budget, service tax rate will be increased, securities transaction tax will be increased, long- term capital gains period will be creased etc. .Many experts spoke about these fears on business channels as will. When most of these fears did not materialize in the budget, there was a pull-back rally. The pull-back rally was mostly a response to fiscal deficit being maintained and hopes of an RBI rate cut, but the bulls who were sitting on the sidelines for the past one or two months also got into the act. The rally on Tuesday, following the budget was so strong, that margin calls would have been triggered off on many F&O short positions. So it was not just the bulls; the bears rushed to square off their short positions to prevent further losses in the last 2 days. This gave even greater strength to the market. There is a common market saying that, the best friend of the market is not the biggest bull, but the most frightened bear. Bears would surely have been frightened over the moves that the market made in the last 2 days. For now, the bulls, and I hope most of us are bulls, can feel happy. But as discussed earlier, bears will always be there in the market along with the bulls. Therefore, bulls should not feel complacent at all. Just like bears have to be extremely cautious at major support levels, bulls have to watch key resistance levels. But for now enjoy.
Technical Perspective
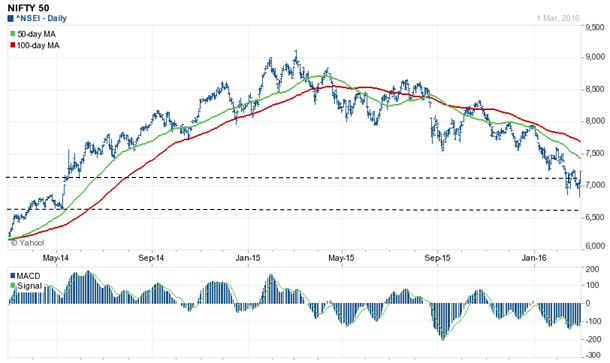
Refer to our blog post, Where will the stock market bottom out: A technical perspective. If you have not read that post, we urge to read it, because we discussed several technical concepts in that post, which you will find useful in the discussion that follows. We had said that 6800 and 6500 were major support levels for the market. Let us briefly recap, why it is a major support. We had discussed in our post, Where will the stock market bottom out: A technical perspective that to determine support levels you should pay attention to levels from which prices reversed earlier or where the market formed a base, because these are likely to keep support levels. Pay attention to the two dotted lines in the 2 year price chart of the Nifty below. Below 7100, we saw a breakout from the 6500 levels. Therefore 6500 is a strong support for the Nifty.
Source: Yahoo Finance
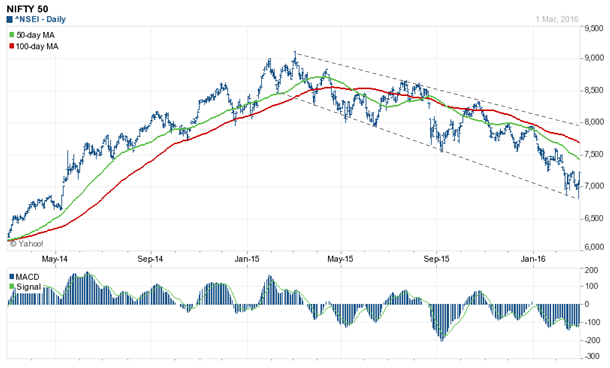
Is there support between 7,100 and 6,500? Some technical analysts have been saying that 6,800 is a strong support. How did they come up with 6,800? Technical analysts use another tool, known as trend-lines to determine support levels. Trend line is the best fit line joining the market bottoms or tops. Trend line is extremely important in technical analysis. There is a saying in technical analysis, “The trend is your friend”. Upper trend line (joining market tops) and lower trend line (joining market bottoms) represent the channel in which the market will be. Focus on the lower trend line, because we are discussing support. Extrapolated to today, the lower trend line indicates support at 6,800. This is an important support level and has proven to be so based on the rally we saw in the market from 6,825 levels or thereabouts. If your friends or colleagues were telling you that Nifty would go down to 6000 or 5000, maybe you will be better off not listening to them and spend some time to increase your knowledge about equity markets, so that you can approach it objectively.
Source: Yahoo Finance
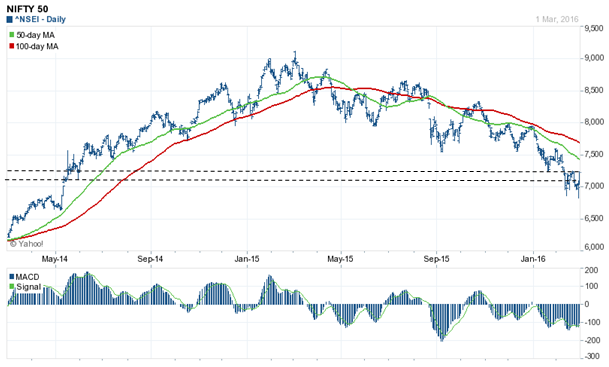
How long will this rally continue? Before we discuss that, you should understand the strength of the 6,800 support. The stronger the pull-back rally from a support level, the stronger is the support level. Since we have seen more than a 500 point rally in Nifty from 6800 or thereabouts, we can infer that it is a strong support. Let us now discuss how much further can the market go up from here onwards? If you have a long investment horizon, the sky is the limit, but in this blog post, we are talking short term. So we have to focus on resistance levels. We have discussed broad characteristics of support and resistance level in our article, Support and Resistance levels: Technical resistance for Nifty at 8000 to 8100. In that article, we had discussed that good support levels on the downside, become good resistance levels on the upside. Please focus your attention on the chart below, especially on the two dotted lines.
Source: Yahoo Finance
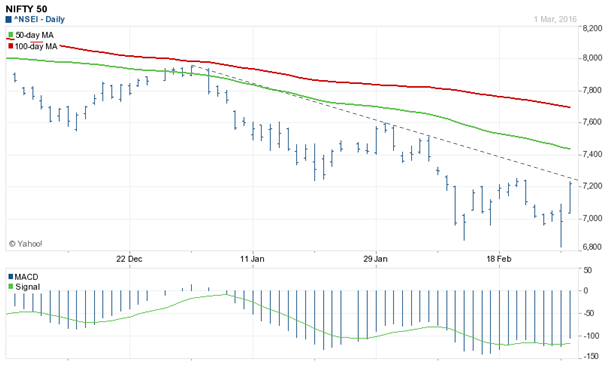
You can see that, 7100 and 7250 on the Nifty are resistance levels. Both these levels have been broken in the last two days. This is bullish in the short term. Why? Let us go back to trend-lines. A range-bound market trades within the trend-lines. But if there is a break-out from the trend-line, it is the indicator of a directional move. Let us now see the last 3 months daily price chart of Nifty. Why only 3 months and not two years? This is because we are interested in short term trend, for now. Focus on dotted line joining the tops over the last 3 months.
Source: Yahoo Finance
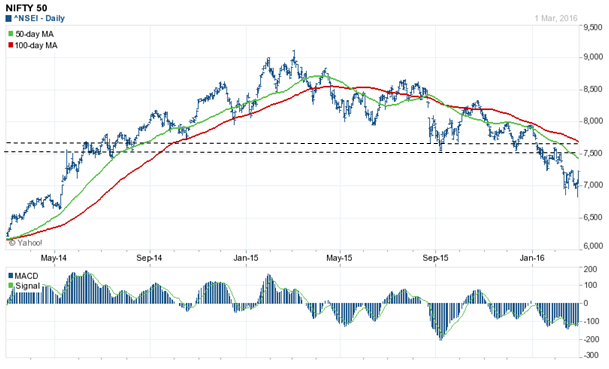
In today’s trading session, the Nifty closed at the 7,375 level which is significantly higher than the upper trend-line. This shows that the Nifty has broken out of the trend. This break-out will take the market higher in the short term, but to what point? Let us go back to the two year price chart of the Nifty. Focus on the dotted lines, which are key resistance levels based on the logic discussed earlier.
Source: Yahoo Finance
You can see that, 7500 to 7600 are the next two key resistance levels. If these two resistance levels are broken convincingly on a closing basis in the next few days, you can even see 8000 on Nifty.
Is caution or confidence warranted? I would strongly urge caution. Why? Refer back to our blog post, Where will the stock market bottom out: A technical perspective. We had spoken about two important concepts, DMAs and MACD. To briefly recap, DMA, as the name suggests, is the daily moving average of the asset prices over a certain rolling period. The market is bullish in the slightly longer term, if the 50 DMA is above the 100 DMA. You can see in the chart above that, the 50 DMA is still below 100 DMA. Therefore, you should tread with caution. Let us now quickly recap another important technical analysis tool, Moving Average Convergence Divergence or simply MACD. By definition, MACD is the difference of 12 day exponential moving average and 26 day exponential moving average (exponential moving average or EMA is a variation of the DMA). MACD is momentum indicator. MACD oscillates above and below the zero line. Positive MACD means upside momentum, which negative MACD means downside momentum. You can see in the chart above that, MACD is still in the negative territory. Therefore you cannot be too sure about this rally.
Investors who are familiar with equity trading and investing know that, correction is the best tool to know market direction. Therefore, investors should wait for a correction. Market has been making lower tops and lower bottoms in the last few months, a clear bearish signal. If the market makes a higher bottom, it will be a positive signal. Wait for a few days and the market will correct for sure. See where the market makes a bottom. If the bottom is higher than the previous bottom, it will be a good sign.
Conclusion of this part
In this part of the two part post, we discussed market dynamics and technical factors, leading up to this rally. We also discussed some important technical factors that investors should keep a close watch on, over the next few days / weeks. In the next part of this post we will discuss the fundamental factors and more importantly, our views on what investors should do over the next few months (to be continued).
Queries
-
What is the benefit of mutual fund STP
Aug 29, 2019
-
How much to invest to meet target amount of Rs 2 Crores
Aug 26, 2019
-
Can I achieve my financial goals with my current mutual fund investments
Aug 24, 2019
-
Can you tell me return of various indices
Aug 19, 2019
-
What would be the post tax return on different investments
Aug 18, 2019
-
Which Principal Mutual Fund scheme will be suitable for my retirement corpus
Aug 16, 2019
-
What is the minimum holding period for availing NCD interest
Aug 4, 2019
Top Performing Mutual Funds
Recommended Reading
Fund News
-
Zerodha Mutual Fund launches Zerodha Nifty Short Duration G Sec Index Fund
Dec 26, 2025 by Advisorkhoj Team
-
Groww Mutual Fund launches Groww Nifty Chemicals ETF
Dec 26, 2025 by Advisorkhoj Team
-
DSP Mutual Fund launches DSP Nifty Next 50 ETF
Dec 19, 2025 by Advisorkhoj Team
-
DSP Mutual Fund launches DSP Nifty 500 Index Fund
Dec 19, 2025 by Advisorkhoj Team
-
Kotak Mahindra Mutual Fund launches Kotak Nifty Next 50 ETF
Dec 18, 2025 by Advisorkhoj Team


