Making sense of volatility in the equity market: A Historical perspective

The volatility in the Indian equity market over the past few weeks is sure to have spooked a lot of retail investors. The Sensex fell over 2,500 points from 28,236 on August 7 to 25,741 on August 24, a nearly 10% decline in little over 2 weeks. In fact the market has been quite volatile through this year, as we can see in the daily chart of Sensex from January to August 25.

Several global macro factors are responsible for the volatility in our equity market. Concerns about the Chinese economy, Euro zone problems concerning the Greek situation, the impending US rate hike, bearish commodity prices are among the major factors causing nervousness in global markets. Adding to the global concerns are domestic factors including the Parliament logjam on key reforms like the GST and Land Acquisition bills, the NPA situation in the banking industry and still weak corporate earnings. From a technical analysis standpoint, the 30 day moving average (DMA) of the Sensex moved below the 100 DMA in April, which is a bearish signal as per technical analysis. The 30 DMA moved below the 200 DMA in May, which reinforced the bearish signal. The causes of volatility notwithstanding, the key question is, should we be unnecessarily worried about it. We will examine this question in our blog today.
At the outset, we should distinguish between traders and investors, since volatility impacts them differently. For traders excessive volatility is both a risk and opportunity. For example, if you are trading in derivatives (futures and options) you can make big profits in volatile markets provided you get your call right. On other hand, if you are on the wrong side of the market move, you can make big losses. In this blog, we will not discuss how volatility impacts traders. Rather we will focus on whether volatility has an impact on long term investors. Investors, by definition, by stocks or mutual funds and stay invested for a long period of time, at least 3 years or more. Stock markets are inherently volatile and more so here in India. One of the reasons of volatility in stock market, apart from macro factors is that price movement is often momentum led. In other words, when the stock prices are moving up, the momentum takes it beyond where fundamentals suggest it should be. Stocks are said to be overbought then and this leads to correction in stock prices, often sharp ones. In a correction, when stock prices are moving down, the downward momentum takes it below its fair valuation. This causes investors to buy stocks. Some corrections are deep and last over a long period of time. This is when we say that, we are in a bear market. In this blog we will see how the Sensex moved over the last 20 years and in particular focus on the deep corrections. We will also examine how the market rebounded after the deep corrections. Investors should note that bear markets are defined by a 20% fall in the benchmark indices. Further the length of the bear market is defined by the period till which the index has not rallied 20% from the market bottom. Over the last 20 years in India, we had different cycles of bull and bear markets. The chart below shows the daily price chart of the Sensex over the last 20 years.

Over the last 20 years, the Sensex has moved from 3,300 levels to around 30,000, a nearly 10 times growth. However, the growth has not been unidirectional. We had many deep corrections over this period, as we can see in the chart above. But not all these corrections took us into the bear market territory, as per the definition of bear markets. Let us focus only on the corrections which caused a bear market for the Sensex in the last 20 year period. Bear markets in our analysis have been defined by a 20% fall in the Sensex, as discussed earlier. Also as per the definition of bear markets, the bear market last until the Sensex rallied 20% or more from the market bottom. Further, we have excluded periods where the Sensex fell by 20% or more and recovered within 3 months.
As per our analysis, we had 5 bear market periods from 1995 to 2015.
- August 1998 – May 1999
- April 2000 – November 2001
- May 2004 – September 2004
- February 2008 – March 2009
- August 2011 – April 2012
Let us now see how deep the correction was during each bear market and for how long it lasted.

We can see from the table above that the bear market corrections ranged from 28% to 60%. So there is no need to panic over a 10% correction. Another interesting observation is the length of the downturn. The longest downturn was 2000 to 2001 bear market and it lasted for about 20 months. Even the 2008 recession, which is by far the most severe bear market we have seen, lasted for only around 14 months. Apart from these two bear market phases, the market recovered within a year.
Let us now see how long the market took to recover its previous high from the bear market low.

The market bottom is usually seen as the darkest period by the investors. But in the above table, we can see that the Sensex recovered to its previous peak within 5 to 7 months in the downturns of 1998-99 and 2004. At worst, it took around 2 years to recover its previous peak, which were also all time highs, from the market bottoms in bear markets of 2001, 2008 and 2013.
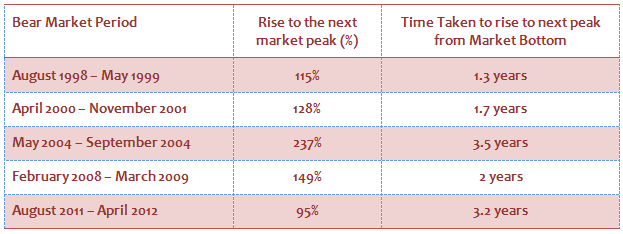
Let us now see how much the Sensex rose from the bear market bottom to the next market peak and also the time taken to rise to the next peak.

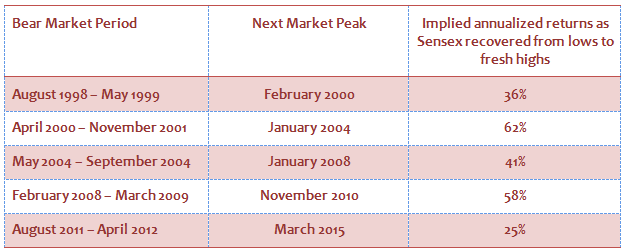
We can see that after deep correction, the market also rebounded furiously and quickly scaled new highs. Therefore, as a long term investor, it is always prudent to remain invested even during deep corrections. Let us see the implied compounded annual returns as the Sensex recovered from market bottom to new highs.

From the table above we can see that the rebound from the market lows has been quite spectacular. In fact investment made in bear markets would have given very high returns in a fairly short period of time. Therefore, it is always advisable to continue Systematic Investments Plans (SIPs) in equity funds during periods of extreme volatility and even bear markets.
Conclusion
We have tried to objectively analyze, periods of extreme volatility and the characteristics of recovery from deep recession. The conclusions are not surprising at all, because over long investment horizon equity as an asset class always gives good returns. As I finish this blog, the Sensex has recovered over 500 points from the year’s low. It is very difficult to predict short term trend of the market. Based on global factors volatility may continue over the coming weeks and even months. Volatility is stressful, but as we have seen in this blog, as a long term investor, one should be patient and adhere to a disciplined investment plans. History has shown that market rewards patience and disciplined investing handsomely.
Queries
-
What is the benefit of mutual fund STP
Aug 29, 2019
-
How much to invest to meet target amount of Rs 2 Crores
Aug 26, 2019
-
Can I achieve my financial goals with my current mutual fund investments
Aug 24, 2019
-
Can you tell me return of various indices
Aug 19, 2019
-
What would be the post tax return on different investments
Aug 18, 2019
-
Which Principal Mutual Fund scheme will be suitable for my retirement corpus
Aug 16, 2019
-
What is the minimum holding period for availing NCD interest
Aug 4, 2019
Top Performing Mutual Funds
Recommended Reading
Fund News
-
SBI Mutual Fund launches SBI Income Plus Arbitrage Active FOF
Apr 23, 2025 by Advisorkhoj Team
-
Motilal Oswal Mutual Fund launches Motilal Oswal Infrastructure Fund
Apr 23, 2025 by Advisorkhoj Team
-
Groww Mutual Fund launches Groww Gilt Fund
Apr 23, 2025 by Advisorkhoj Team
-
Bajaj Finserv Mutual Fund launches Bajaj Finserv Nifty Next 50 Index Fund
Apr 22, 2025 by Advisorkhoj Team
-
Mirae Asset Investment Managers (India) Pvt. Ltd. IFSC branch launches Mirae Asset Global Allocation Fund IFSC at Gift City
Apr 21, 2025 by Mirae Asset Mutual Fund


