Is the Indian equity market over valued at current levels

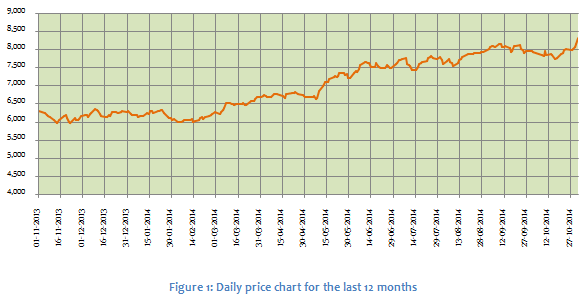
On the close of trading session on Friday the market closed at historical highs on positive global cues. The Sensex and Nifty closed at 27,866 and 8,322 respectively. In the last 12 months the Nifty has given a return of nearly 32%. The chart below shows the rally of the Nifty from 6,000 to current levels in the last one year.

Whenever the market scales historical highs it causes both euphoria and trepidation. While the majority opinion about the market is bullish, some people are voicing concerns that the market is in the over-valued territory or thereabouts. Are these concerns real? It is true that corporate earnings have not kept pace with Nifty’s rise to dizzying heights in the last one year. If the market is indeed over-valued, then we may see a period of consolidation or even correction, till earnings catch up to justify the share prices. During such corrections from very high, one often sees panic selling causing markets to fall sharply. But before you rush to redeem your equity funds, let us rationally think about the question, is the Indian equity market is over-valued at current levels?
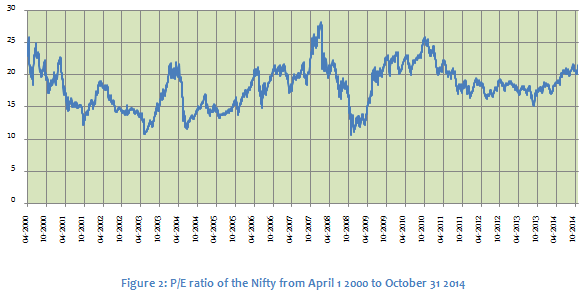
There is no definitive level that defines over-valuation or under-valuation. Share prices are determined by investor’s perceptions or expectations. Therefore the question is whether investors perceive the market to be over-valued? Investors do not want to over-pay for a stock. Among the several factors that influence share prices, price earnings ratio (P/E) is the one that is most widely used. P/E ratio is by no means the most accurate determinant of share prices. If it were, we would not have seen the outrageous valuations at the past bull market peaks. There are several other factors like liquidity, policy, sentiments etc. Nevertheless, P/E ratio can be used as a broad guidance for determining relative valuation of shares and the market. The Nifty is now trading at a P/E ratio of 21.6. Twelve months back the P/E ratio of Nifty was 18.2. Is the Nifty more expensive than it was 12 months back? Yes. But is it too high? Let us take a historical perspective. In April 2000 the Nifty was trading at a P/E ratio of 24.2, higher than what it is today. At the peak of the bull market in 2007 the Nifty was trading at a P/E ratio of 27.9, much higher than what is today. Even in 2010 and early 2011, the Nifty P/E ratio was near 24.5. The chart below shows the historical P/E ratios of the Nifty from April 1 2000 to the close of the last trading session (October 31 2014).

We are still way off the historical highs as far Nifty valuations are concerned. Based on historical peaks, there is certainly room for the Nifty to go further up in terms of valuations. However, comparing current Nifty P/E with historical highs is not without risks. The market invariably corrected very sharply from the historical highs. With the benefit of hindsight, we can say that the P/E ratios in 2000, 2007 and 2010 were over-stretched. The P/E ratios corrected sharply from those levels to much lower levels compared to where we are today.
A more reliable method to determine relative over-valuation or under-valuation is to compare the current P/E ratio with the long term average and see if the divergence from the long term average P/E ratio is within certain tolerance limits, as measured by standard deviations. The 5 year average P/E ratio of the Nifty is 19.7 and the 10 year average is 19.2. The 5 year standard deviation of daily P/E ratios is 2.3, while the 10 year standard deviation is 3. The current Nifty P/E ratio is well above the 5 year and 10 year average, but it is still within one standard deviation from the average. The theory of technical analysis suggests that the P/E ratio will be within one standard deviation of the long term average nearly 70% of the time. There is only a 5% probability that the P/E ratio will exceed two standard deviations from the average. If the P/E ratio is higher than 2 standard deviations from the average, then the market is overvalued. Adding two standard deviations of the Nifty P/E to the 10 year average we get a P/E of 25.2. If the Nifty P/E ratio reaches that level, it will be in the overbought or over-valued territory, as per technical analysis. Therefore at the current P/E of 21.6, we can say with a reasonable degree of confidence that the Nifty is not yet over-valued.
Conclusion
Given the sharp rise in the Sensex and Nifty in the last few days, we may see some profit booking and consolidation in the market. But market experts are of the opinion that the Nifty and Sensex will scale new highs in the coming months. Experts recommend staying invested and buying on dips. Investing in diversified equity funds through systematic investment plans is very effective during periods of volatility. We are still in the early stages of a secular bull market. You should not worry about timing the markets at this stage. Even at current levels, there is enough upside in equities for long term investors to create wealth.
Queries
-
What is the benefit of mutual fund STP
Aug 29, 2019
-
How much to invest to meet target amount of Rs 2 Crores
Aug 26, 2019
-
Can I achieve my financial goals with my current mutual fund investments
Aug 24, 2019
-
Can you tell me return of various indices
Aug 19, 2019
-
What would be the post tax return on different investments
Aug 18, 2019
-
Which Principal Mutual Fund scheme will be suitable for my retirement corpus
Aug 16, 2019
-
What is the minimum holding period for availing NCD interest
Aug 4, 2019
Top Performing Mutual Funds
Recommended Reading
Fund News
-
Zerodha Mutual Fund launches Zerodha Nifty Short Duration G Sec Index Fund
Dec 26, 2025 by Advisorkhoj Team
-
Groww Mutual Fund launches Groww Nifty Chemicals ETF
Dec 26, 2025 by Advisorkhoj Team
-
DSP Mutual Fund launches DSP Nifty Next 50 ETF
Dec 19, 2025 by Advisorkhoj Team
-
DSP Mutual Fund launches DSP Nifty 500 Index Fund
Dec 19, 2025 by Advisorkhoj Team
-
Kotak Mahindra Mutual Fund launches Kotak Nifty Next 50 ETF
Dec 18, 2025 by Advisorkhoj Team


