Elections results and equity market

The impact of elections on Indian equity market is well known. When election results were in line with the market expectations then market rose sharply, and when they were not in line with market expectations the market crashed. Let us take the example of the last 4 general elections. In 1999 Lok Sabha election, the market was expecting an NDA victory. The market was not disappointed, as NDA comfortably crossed the halfway mark with TDP support. In the three market sessions since the counting began in October 1999, the Sensex surged over 300 points, quite a sharp rise in percentage terms, as the Sensex was only around 4,600 then. In the 2004 Lok Sabha elections, the markets were expecting another NDA victory and a second term for the government. However, the election results were disappointing for the NDA. In the three market sessions since the counting began in May 2004, the Sensex crashed and lost over 700 points. Congress led UPA formed the government with outside support from several political parties. The first UPA government term, also known as UPA -1, coincided with the period of high GDP growth in India and in the 2009 Lok Sabha elections, the market was expecting another UPA victory. The market this time was not disappointed and the Sensex rallied over 2,000 points on a closing basis when results were declared. In the recently concluded Lok Sabha elections, the market was expecting a decisive NDA victory. The NDA victory has been more than decisive. The Sensex rallied over 1,000 points when results were declared last Friday, but corrected intra-day on the back of heavy profit booking and closed over 200 points higher.
However, while the media gives a lot of importance to the impact of election results on equity market, the reality is that the euphoria or disappointment, whatever the case may be, dissipates within a few days and then it is back to fundamentals like macro-economic factors, fiscal policies, corporate earnings and the global factors. Let us take the case of the general elections of 1999 and the NDA victory. As discussed earlier, the market welcomed the election results with a 7% rally in the Sensex. Now let us see how the market performed during the term of the NDA government. Please see below, the daily closing price chart of Sensex during the term of the NDA Government from 1999 to 2004.

In the first few months during the term of the NDA government the Sensex rallied over 20%, and then fell over 50% from April 2000 to October 2001. A combination of local factors like the Ketan Parekh scam and global factors like dotcom bubble and 9/11 caused the market to crash. The market was in the firm grip of the bears for a period of time, but recovered on the back of strong GDP growth and number of reform oriented policy initiatives implemented by the government. From the end of 2001 to the end of the term of the NDA government, the bulls took control of the market and Sensex rallied over 100%. But what was the absolute return on the Sensex during the term of the NDA government? The absolute return on the Sensex during this period was a little over 14%. On an annualized return basis, the Sensex gave a compounded annual return of around 3% during this period. As an equity investor you would be disappointed with those returns. But what if you had invested in equity funds through SIPs, during this period? You would have purchased units when the Sensex was between 3000 and 4000, from 2001 to 2003. In about 5 year’s time, by the end of 2007, the Sensex would be over 20,000. It is something that retail investors should ponder over.
In 2004 Lok Sabha elections, the market was expecting an NDA victory. When NDA lost the election, the Sensex lost 15% in two or three trading sessions. The market was concerned about the stability of the UPA led coalition and worried about the course of economic reforms because the UPA government had to depend on the support of the Left Front. Let us now see how the market performed during the term of the UPA - 1 government. Please see below, the daily closing price chart of Sensex during the term of the UPA -1 Government from 2004 to 2009.

From the 4,500 levels, when the UPA government took office, the market rallied to nearly 21,000 by the end of 2007, the strongest bull market rally in India. The markets were helped by strong GDP growth and Foreign Institutional Investor flows into Indian equity market. This period was also, generally, very strong for global equities. In 2008, global equity markets crashed and the global economy entered a period of severe recession. The Indian equity market was acutely impacted by the global recession and went through one of the worst bear market phases. The Sensex crashed 60% to nearly 8,500 by November 2008. The markets recovered quite well in 2009 and by the time the country went to polls in May 2009, the Sensex was well over 12,000. What was the absolute return on the Sensex during the entire term of the UPA - 1 government? The absolute return on the Sensex during this period was nearly 150%, despite the severe recession. On an annualized basis, the compounded return was over 20%. Therefore, even though the markets crashed after the election results in 2004, equity investors got outstanding returns on their investments during this period, despite the recession.
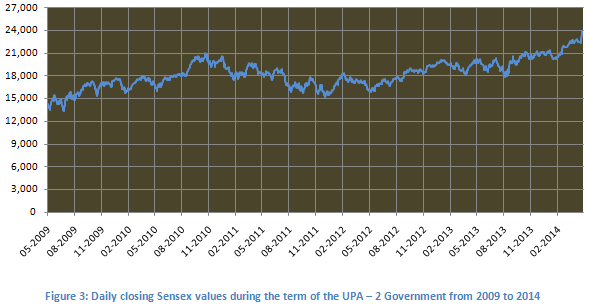
So far, we have seen two contrasting stories. One, in which the market got the election results they were expecting (in 1999), but did not do that well in the 5 year period following the elections. Another, in which the market did not get the election results they were expecting, but did spectacularly in the 5 year period following the elections. In the Lok Sabha elections of 2009, the market was expecting an UPA win. They were not disappointed. The market responded by rallying over 20% (over 2000 points) on the Sensex. Now let us see how the market performed during the term if the UPA – 2 Government. Please see below, the daily closing price chart of Sensex during the term of the UPA - 2 Government from 2009 to 2014.

From the 14,000 levels, when the UPA – 2 government resumed office, the Sensex rallied to over 20,000 by the end of 2010. The market corrected to 15,000 levels on the Sensex in the bear market of 2011, before resuming its upward trend to north of 20,000. For the overall economy, this was not a good period, as GDP growth slowed down, inflation rose stubbornly and the government was hit by a series of high profile corruption scandals. During the term of the UPA – 2 Government, the Sensex gave an absolute return of 67% over five years. However, most people familiar with the market will agree that the last 20% leg of the rally could be attributed to, what is popularly known as, the Modi Effect. In the last 6 months the Sensex rose nearly 20% primarily in anticipation of an NDA led stable government in the centre. On an annualized basis, the compounded return during the term of the UPA – 2 Government was slightly less than 11%. But if we normalize for the Modi effect, post the state elections in December 2013, the annualized return during this term was about 8.7%.
Conclusion
We have seen that the impact of election results on equity markets lasts only for a few days. The focus then shifts back to fundamentals and global factors. There is a lot of expectation that, the new government will take decisive policy measures to put India back on the path of strong economic growth, which in turn will lead the market to higher levels. The truth about equity markets is that they always scale new highs. There will be periods of correction and consolidation in between, but in the long term the market will create historical highs. This is because share prices rise as corporate earnings grow. The secret sauce of wealth creation is therefore disciplined investing. In our next article, we will see how your mutual funds have performed after each election.
Queries
-
What is the benefit of mutual fund STP
Aug 29, 2019
-
How much to invest to meet target amount of Rs 2 Crores
Aug 26, 2019
-
Can I achieve my financial goals with my current mutual fund investments
Aug 24, 2019
-
Can you tell me return of various indices
Aug 19, 2019
-
What would be the post tax return on different investments
Aug 18, 2019
-
Which Principal Mutual Fund scheme will be suitable for my retirement corpus
Aug 16, 2019
-
What is the minimum holding period for availing NCD interest
Aug 4, 2019
Top Performing Mutual Funds
Recommended Reading
Fund News
-
Motilal Oswal Mutual Fund launches Motilal Oswal Diversified Equity Flexicap Passive Fund of Funds
Jan 2, 2026 by Advisorkhoj Team
-
Mr. Navneet Munot's 'Person of the Year 2025'
Dec 31, 2025 by HDFC Mutual Fund
-
Zerodha Mutual Fund launches Zerodha Nifty Short Duration G Sec Index Fund
Dec 26, 2025 by Advisorkhoj Team
-
Groww Mutual Fund launches Groww Nifty Chemicals ETF
Dec 26, 2025 by Advisorkhoj Team
-
DSP Mutual Fund launches DSP Nifty Next 50 ETF
Dec 19, 2025 by Advisorkhoj Team


