ICICI Prudential Top 100 Fund: 20 times returns in 18 years from this large cap mutual fund

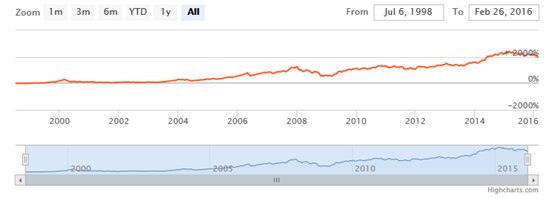
The last one year has been very challenging for equity markets. The leading market indices like the Sensex / Nifty have fallen more than 20% from their 52 week high and we are in a bear market now. Market turmoil is expected to continue till we see improvement in global macro-economic situation and sentiments. It is important to understand that volatility is an intrinsic characteristic of equity markets. In our post, Making sense of volatility in the equity market: A Historical perspective, we have discussed how markets recovered after each bear phase and made new highs. Therefore, if you remain invested in equities over a long period of time, you can create wealth. ICICI Prudential Top 100 fund is a great example of how wealth can be created by investing in equity funds over a long time horizon. If you had invested र 1 lac in ICICI Prudential Top 100 fund at the time of its launch almost 18 years back, the value of your by now would have been around र 21 lac, which means you would have made a tax free profit of र 20 lac on an investment of just र 1 lac. Over the last 18 years, we saw at least five bear markets when markets fell 25 – 60%, yet ICICI Prudential Top 100 Fund gave nearly 19% compounded annual returns during this period. Morningstar has given a 4 star rating to this fund.
Fund Overview
The fund was launched in July 2009 and has an AUM base of र 1,290 crores. The expense ratio of this large cap fund is 2.3%. Sankaran Naren and Mittui Kalawadia are the fund managers of ICICI Prudential Top 100 fund. ICICI Prudential is one of the largest asset management companies, with a stellar track record of strong performance across several mutual fund product categories. Though ICICI Prudential Top 100 fund has given negative returns in the last one year, it has outperformed the large cap funds category across different time-scales. The table below shows the trailing returns of the fund and the large cap funds category, over the last 1, 3, 5 and 10 year periods (NAVs on 26.02.2016).

Source: Advisorkhoj Research
The chart below shows the NAV movement of the fund since inception.
Source: Advisorkhoj Research
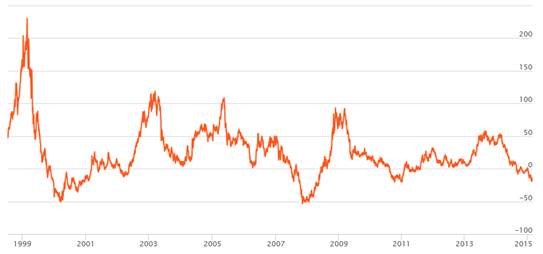
The chart below shows the 1 year rolling returns of ICICI Prudential Top 100 fund since inception. Rolling returns are the annualized returns of the scheme taken for a specified period on every day and taken till the last day of the duration.
Source: Advisorkhoj Rolling Returns Calculator
We can see that the rolling returns of the fund have been volatile and at times have dipped into the negative territory. But we can also see that from time to time the fund has given 50 to 100% annual returns. These periods of spectacular returns have enabled the fund to offset volatility and create wealth for investors. Investors can in fact, take advantage of the volatility by investing through the monthly SIP mode. Let us see how much corpus an investor could have accumulated by investing र 3,000 monthly in ICICI Prudential Top 100 Fund through systematic investment plan (SIP) over the last 15 years.
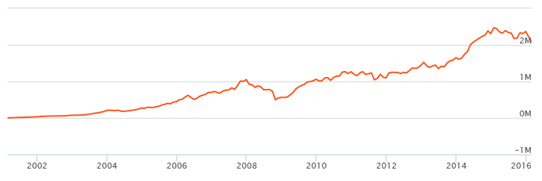
By investing र 3,000 monthly in ICICI Prudential Top 100 Fund through SIP over the last 15 years, an investor could have accumulated a corpus of almost र 21 lacs with a cumulative investment of little over र 5.4 lacs. This means that the investor would have made a profit of over र 15 lacs with a cumulative investment of र 5.4 lacs. This shows the power of investing through the SIP mode.
Portfolio Construction
The investment style of the fund managers is a mix of value and growth styles. The fund has a large cap bias. Large cap stocks account for 75% of the portfolio value. Over the past year or so, large cap stocks have underperformed small and midcap stocks. This is a strange phenomenon because in bear markets we expect large cap stocks to outperform small and midcap stocks. The underperformance for large cap stocks has been attributed to activity of Foreign Institutional Investors (FIIs). FIIs invest primarily in large cap stocks. Since FIIs have been pulling out money from India over the past few months, prices of large cap stocks have been affected more adversely than small and midcap stocks. In fact, the average valuations (P/E ratios) of large cap stocks are now lower than the average valuation of midcap stocks. The P/E ratio of Nifty Midcap Index as on 26.02.2016 is 21.5, whereas the P/E ratio of Nifty is 19. This is an abnormal situation and many fund managers believe that large cap stocks will outperform midcap stocks, when the market recovers.
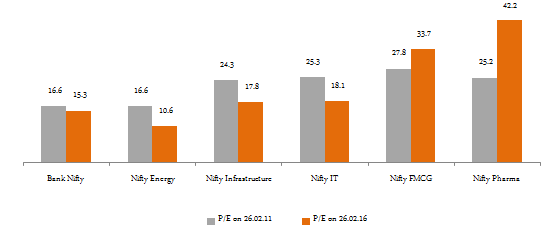
In terms of sector allocations of ICICI Prudential Top 100 fund, cyclical sectors comprise the majority of portfolio holdings. Banks, power, automobiles and auto ancillaries, oil and gas, metals etc, comprise the majority of the fund’s sector allocation. Around 24% of the fund’s portfolio holdings are in defensive sectors like technology, FMCG and pharmaceuticals. Cyclical sectors usually suffer the most in terms of share prices in bear markets, because revenues and earnings of cyclical sectors depend on the domestic consumption, which has been weak for some time now. However, when the economy recovers cyclical sectors outperform defensive sectors. Market experts and fund managers believe that many large cap stocks are now trading at very attractive valuations and can give excellent returns to investors over a sufficiently long investment horizon. Let us understand this a bit more by comparing current P/E ratios of key sector indices with their P/E ratios five years back.
Source: National Stock Exchange
The gray bars show the P/E ratios of key sector indices on 26.02.11, while the orange bar shows the P/E ratios of these indices on 26.02.16. You can see that the P/E ratios of many sectors, e.g. Banks, Energy, Infrastructure and IT have actually shrunk in the last 5 years. These sectors comprise a substantial portion of ICICI Prudential Top 100 portfolio. Now compare the P/E compression of Banks, Energy, Infrastructure and IT with the P/E expansion of Pharmaceuticals and FMCG. Within each sector the extent of P/E compression is different for different stocks. This clearly shows that, there is potential of substantial valuation upside in certain sectors and for specific stocks within the sectors. Therefore fund managers believe that investors can make excellent returns over a long time horizon by investing at these levels.
From a company concentration standpoint the ICICI Prudential Top 100 fund is fairly well diversified. The top 5 stock holdings Power Grid, HDFC Bank, Tata Motors, ICICI Bank and Great Eastern Shipping account 36% of the fund portfolio. The top 10 stock holdings account for around 50% of the fund portfolio. The table below shows some key price statistics of top stock holdings of ICICI Prudential Top 100 fund.
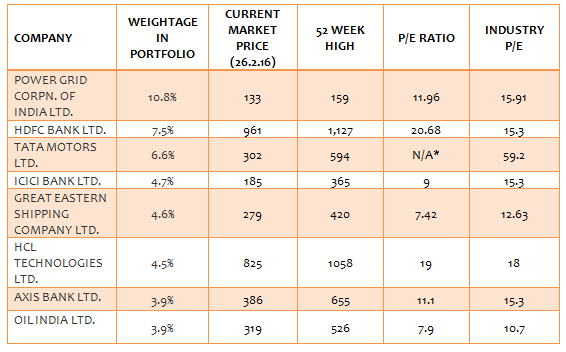
*Tata Motors has reported loss, therefore P/E is Not Applicable
Source: Moneycontrol.com
While the extent of price destruction has varied from stock to stock, you can see from the table above all these stocks are trading 15 to 50% below their 52 week highs. We had discussed earlier that the P/E ratio of certain sectors have compressed over the last 5 years or so. Within these sectors, in the table above, you can see that P/E ratio of many stocks in the table above is below the industry P/E ratio. These can be pockets of deep value when the market recovers. After all these companies are leading names in their respective sectors with strong managements. It is true that some sectors e.g. banks are facing serious challenges. We do not think that we know the full extent of the Non Performing Assets problem in the banks. But both the Government and the Reserve Bank India is addressing this issue with a sense of urgency. Overall, one can expect that the portfolio of ICICI Prudential Top 100 Fund to do well in the long term, once the economy recovers.
Key Performance Statistics
The table below shows the key performance statistics of ICICI Prudential Top 100 Fund.

Source: Morningstar
You can see that the ICICI Prudential Top 100 Fund has outperformed the large cap funds category on all these performance parameters. This should reinforce investor’s confidence in the fund managers.
Dividend History
ICICI Prudential Top 100 Fund has a very strong dividend pay-out track record. The fund has paid dividends every year since inception, even in difficult market conditions. The dividend yield is also quite good, as you can see in the table below.
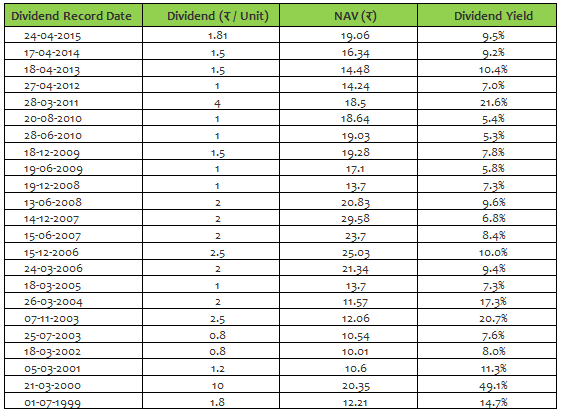
Source: Advisorkhoj Historical Dividends
Conclusion
ICICI Prudential Top 100 Fund has delivered 18 years of strong performance. Investors can investment in this fund, both in lump sum or through the Systematic Investment Plan or SIP mode, towards their long term financial goals like retirement planning etc. However, you should have a long investment horizon to get the best results. Investors who wish to earn tax free dividends can also invest in ICICI Prudential Top 100 Fund. While the fund has a great dividend pay-out track record, investors should remember that mutual funds cannot assure dividend pay-outs either with respect to the amount or the frequency of pay-outs. Investors should consult with their financial advisors if ICICI Prudential Top 100 Fund is suitable for their investment portfolios.
Queries
-
What is the benefit of mutual fund STP
Aug 29, 2019
-
How much to invest to meet target amount of Rs 2 Crores
Aug 26, 2019
-
Can I achieve my financial goals with my current mutual fund investments
Aug 24, 2019
-
Can you tell me return of various indices
Aug 19, 2019
-
What would be the post tax return on different investments
Aug 18, 2019
-
Which Principal Mutual Fund scheme will be suitable for my retirement corpus
Aug 16, 2019
-
What is the minimum holding period for availing NCD interest
Aug 4, 2019
Top Performing Mutual Funds
Recommended Reading
Fund News
-
Sundaram Mutual Fund launches Sundaram Income Plus Arbitrage Active FoF
Jan 5, 2026 by Advisorkhoj Team
-
Kotak Mahindra Mutual Fund launches Kotak Dividend Yield Fund
Jan 5, 2026 by Advisorkhoj Team
-
Motilal Oswal Mutual Fund launches Motilal Oswal Diversified Equity Flexicap Passive Fund of Funds
Jan 2, 2026 by Advisorkhoj Team
-
Mr. Navneet Munot's 'Person of the Year 2025'
Dec 31, 2025 by HDFC Mutual Fund
-
Zerodha Mutual Fund launches Zerodha Nifty Short Duration G Sec Index Fund
Dec 26, 2025 by Advisorkhoj Team


