UTI MIS Advantage Fund: One of the best Mutual Fund MIPs for conservative investors

Mutual Fund monthly income plans are debt oriented hybrid funds. Usually a maximum of 25% of the asset allocation goes to equity and the balance to debt. The debt portion of the asset allocation ensures stability of income, while the equity portion provides a kicker to returns by way of capital appreciation. As such Monthly Income Plans have quite limited exposure to market volatility compared to equity oriented funds. UTI MIS Advantage Fund is one of the best mutual fund monthly income plans. Currently 23% of the asset allocation is in equity and the balance is in debt and cash. CRISIL has the highest ranking for this fund in the Monthly Income Plan category and Morningstar has a 4 star rating for this fund.
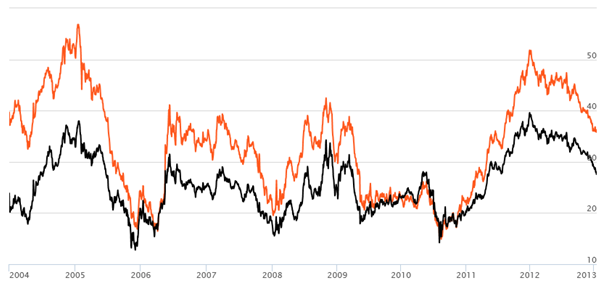
The chart below shows the 3 year rolling returns of UTI MIS Advantage Fund (growth option) since inception. We have chosen 3 years as the rolling return period because investors should have a long investment horizon when investing in Monthly Income Plans. Further, since UTI MIS Advantage Fund is a debt oriented fund the tax treatment is most favourable if the investment holding period is more than 3 years.
Source: Advisorkhoj Research
Rolling returns are the total returns of a fund taken for a specified period on every day and taken till the last day of the duration. In this chart we are showing 3 year rolling returns on every day from inception of UTI MIS Advantage Fund (orange line) and comparing it with the benchmark, CRISIL MIP Blended Index (black line). Rolling returns is the best measure of a fund's performance. Trailing returns have a recency bias and point to point returns are biased by market conditions during the period in consideration. Rolling returns, on the other hand, measures the fund's absolute and relative performance across all timescales without bias. If you analyze the above chart, you will see that, the fund returns rarely dipped below the benchmark. This is the hallmark of a consistent performer. You will further notice that by and large, the performance gap between the fund and the benchmark has also been consistent. This shows that the fund manager employs a consistent approach and does not take excessive risks. We can make some more interesting observations from the rolling return chart. You can see that the 3 year rolling returns did not dip below 20% (around 6% on an annualized basis) except for a few months over the last 12 years, implying that, if you invested in lump sum in the fund, you could have made withdrawals of 6% of the investment every year and still see substantial capital appreciation of your investment. Approximately 65% of the times, 3 year rolling returns were above 30% (around 9% on an annualized basis). From time to time, the fund gave as high as 40 to 50% 3 year rolling returns (around 12% to 14% on annualized basis). This was the effect of the equity kicker and over a long investment horizon, through the power of compounding will create significant capital appreciation for investors. From the above analysis it is evident that over a long period of time, on an average the UTI MIS Advantage Fund beat the returns given by Post Office Monthly Income scheme. However, investors should remember that mutual funds are subject to market risks and cannot assure returns like Post Office schemes. We spent a fair amount of time analyzing the rolling returns not only to showcase the strong performance of UTI MIS Advantage Fund, but also to help our readers understand the power of Rolling Returns as an analytical tool.
Fund Overview of UTI MIS Advantage Fund
UTI MIS Advantage Fund was launched in December 2003. The scheme has around र 660 crores of Assets under Management with an expense ratio of 1.85%. Amandeep Chopra and Ajay Tyagi are the fund managers of this scheme. Other than growth option, the scheme is open for subscriptions for monthly payment, flexi dividend and monthly dividend options. We will discuss these options later.
UTI MIS Advantage Fund Portfolio
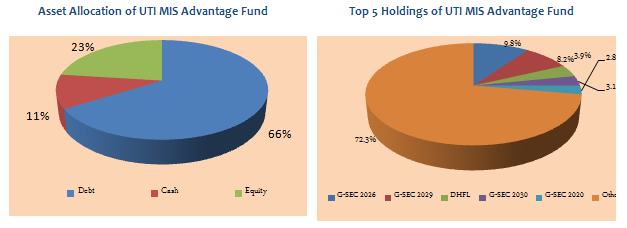
66% of the fund portfolio is invested in fixed income securities, 11% in cash equivalents and 23% in equities. The credit quality of the debt portfolio is excellent. The average maturity of the debt portfolio is 6.6 years, which makes the fund moderately sensitive to interest rate movements. If bond yields harden for a variety of factors, like the impact of Central Government pay increases on the fiscal deficit, rupee depreciation, food price inflation etc, we can see some volatility in NAVs. However, if the long term outlook on interest rates is favourable then good returns can be expected from bonds over a sufficiently long time horizon. The credit quality of the bond portfolio is excellent with 84% of the bond portfolio is rated AAA and 15% rated AA. The equity portfolio has a small bias towards cyclical sectors like banking and finance, metals, capital goods etc, which can give good returns once the capex cycle revives in the economy. However, the equity portfolio is well balanced with substantial allocations to defensive sectors like pharmaceuticals, technology and FMCG. The fund is well diversified from the perspective of company concentration.
Source: Advisorkhoj Research
Risk and Return of UTI MIS Advantage Fund
In terms of volatility measures, the standard deviation of returns of UTI MIS Advantage Fund is quite low at only 5.1%. In terms of risk adjusted returns, as measured by Sharpe ratio, the fund clearly outperforms average conservative hybrid funds by a big margin.
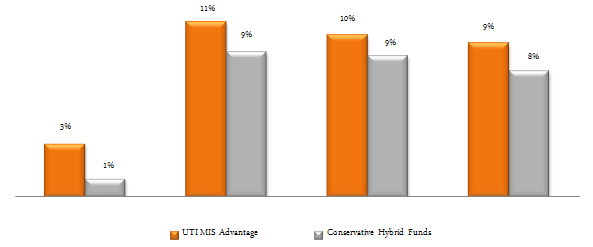
In terms of annualized trailing returns, the fund has beaten average debt oriented hybrid funds across all time-scales since inception.
Source: Advisorkhoj Research
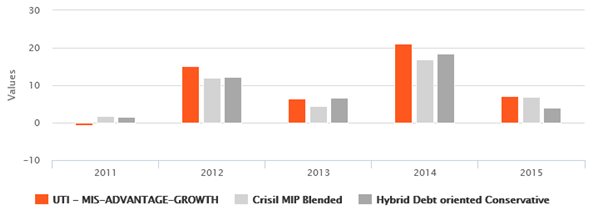
The chart below shows the annual returns of the UTI MIS Advantage Fund over the last 5 years. Again the fund has outperformed the benchmark and the category in most years.
Source: Advisorkhoj Research
The chart below shows growth of र 1 lac lump sum investment in the UTI MIS Advantage Fund (Growth Option) over the last 10 years. The orange line shows the returns of the fund and the grey line shows the benchmark returns.

Source: Advisorkhoj Research
Even the SIP return over the past 10 years was quite impressive, considering the conservative risk characteristics of the fund. With a र 5,000 monthly SIP, an investor could have accumulated a corpus of nearly र 10 lacs with a cumulative investment of just र 6 lacs. The orange line shows the returns of the fund and the grey line shows the benchmark returns.

Source: Advisorkhoj Research
Investment options in UTI MIS Advantage Fund
Investors can select from 4 options:-
Growth Option:
The accrued income or profits in the scheme will remain invested and investors will benefit through the power of compoundingFlexi Dividend Option:
In this option dividend will be paid from time to time, at the discretion of the fund houseMonthly Dividend Option:
In this option, the fund house will endeavour to pay monthly dividends to the investor. However, investors should note that there is no assurance with respect to the dividend amount; neither is there any guarantee that dividends will be paid monthly. Please note that UTI MIS Advantage Fund is a debt fund from a tax perspective. Therefore, dividend distribution tax will be deducted by the fund house before paying dividends to investors.Monthly Payment Option:
In this option the investor can opt to receive monthly payments which UTI Mutual Fund will make by redeeming units of the scheme. This option is very much like Systematic Withdrawal Plan offered by mutual funds. Please note that since the monthly payment is made by redemptions of units, the fund house will not deduct any tax. But since UTI MIS Advantage Fund is a debt fund, the investor will be required to pay short term or long term capital gains tax, depending on the holding period of the units.
Monthly Dividend Pay-out Track Record of UTI MIS Advantage Fund
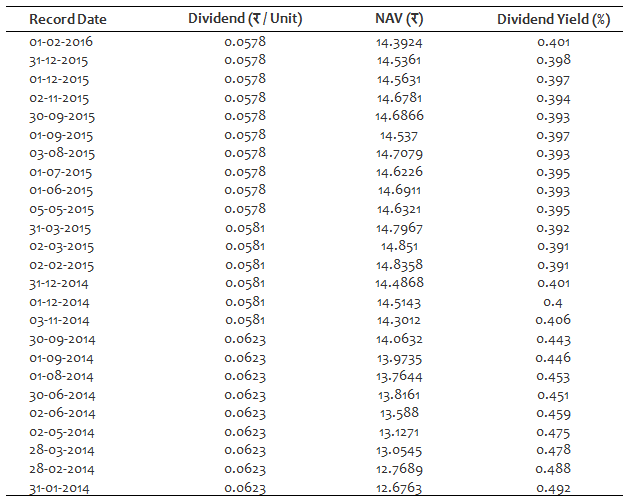
UTI MIS Advantage Fund has an excellent track of making monthly dividend payments. The table below shows the monthly dividend pay-out track record of the scheme over the past two years. You can check the long term dividend pay-out track of the scheme since inception by clicking on the ------> UTI MIS Advantage Fund Monthly Dividend History
Source: Advisorkhoj Research
The monthly dividend yield has been in the range of approximately 0.4 – 0.5%. The annual dividend yield is therefore in the range of 5 – 6%. You can see that in addition to the monthly dividends the NAV of this option has grown by about 14% in the last 2 years.
Conclusion
UTI MIS Advantage Fund has recently completed 12 years. The fund has a very strong track record and as such is an excellent choice for investors who want both income and some capital appreciation over a long investment horizon. Since the fund has around 25% asset allocation to equity, investors should have tolerance for short term volatility, especially in these market conditions. Investors should discuss with their financial advisors if UTI MIS Advantage Fund is suitable for their investment needs.
Queries
-
What is the benefit of mutual fund STP
Aug 29, 2019
-
How much to invest to meet target amount of Rs 2 Crores
Aug 26, 2019
-
Can I achieve my financial goals with my current mutual fund investments
Aug 24, 2019
-
Can you tell me return of various indices
Aug 19, 2019
-
What would be the post tax return on different investments
Aug 18, 2019
-
Which Principal Mutual Fund scheme will be suitable for my retirement corpus
Aug 16, 2019
-
What is the minimum holding period for availing NCD interest
Aug 4, 2019
Top Performing Mutual Funds
Recommended Reading
Fund News
-
SBI Mutual Fund launches SBI Income Plus Arbitrage Active FOF
Apr 23, 2025 by Advisorkhoj Team
-
Motilal Oswal Mutual Fund launches Motilal Oswal Infrastructure Fund
Apr 23, 2025 by Advisorkhoj Team
-
Groww Mutual Fund launches Groww Gilt Fund
Apr 23, 2025 by Advisorkhoj Team
-
Bajaj Finserv Mutual Fund launches Bajaj Finserv Nifty Next 50 Index Fund
Apr 22, 2025 by Advisorkhoj Team
-
Mirae Asset Investment Managers (India) Pvt. Ltd. IFSC branch launches Mirae Asset Global Allocation Fund IFSC at Gift City
Apr 21, 2025 by Mirae Asset Mutual Fund


