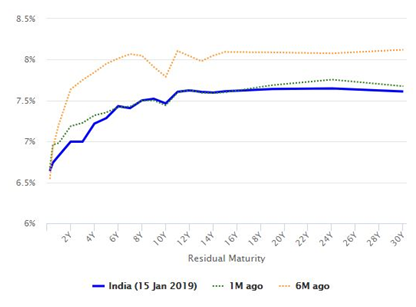
Yield curve is also known as the term structure of interest rates. It is a line chart showing yields of bonds of different maturities. The chart below shows the yield curve of Indian Government bonds. The X-axis (horizontal axis) represents residual maturities of different bonds, while the Y-axis (vertical axis) represents corresponding yields.
Usually, longer the maturity of a bond, higher is its yield. Therefore, the most common shape of the yield curve is upward sloping. However, from time to time, the yield curve can assume a downward sloping trajectory. Downward sloping yield curve, also known as inverted yield curve, usually signifies recession. Debt fund managers invest in different points of the yield curve depending on the risk profile of their respective schemes and their interest rate outlook. Yield curves can also help investors to decide which debt fund duration profiles they want to invest in based on risk / return trade-offs.


